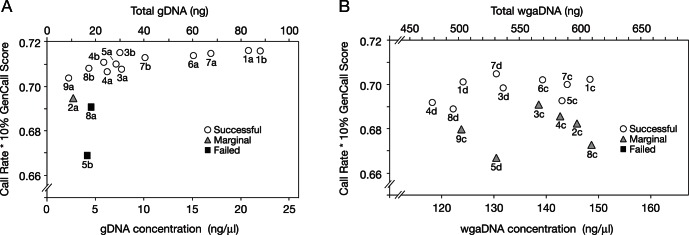
Figure 2. Genotyping performance as a function of gDNA concentration.

The genotyping performance of the gDNA samples (A) and wgaDNA samples (B) described in Figure 1 is plotted against the DNA concentration of the sample as determined by Qubit for gDNA and Picogreen for wgaDNA (bottom axis) and total amount of DNA used (4 µl) during each genotyping run (top axis). Picogreen was used for wgaDNA because Qubit does not discern concentrations above 100 ng/µl. Note that all gDNA samples with DNA concentrations above 5 ng/µl (∼20 ng DNA) were genotyped successfully (A). No similar threshold was observed for wgaDNA samples (B).
