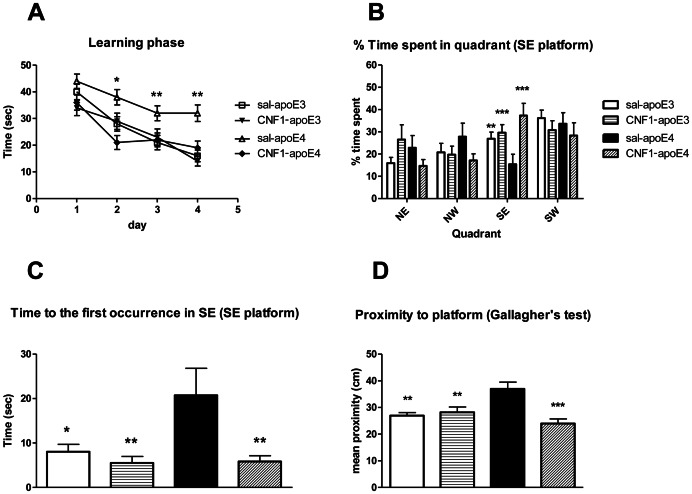
Figure 1. Effects of apoE genotype and CNF1 treatment in the Morris water maze test.
Morris water maze performance in 12 month-old apoE3 and apoE4 (13–14 mice/group) with a intraventricular saline or CNF1 (0.1 nM) injection. A. Learning curve for training to find the hidden platform in the Morris water maze. The latency to find the platform in the 4 sessions of each day was averaged in order to obtain one value/animal/day. Mean ± standard error of the mean (SEM) values are shown. Statistical analysis of the overall learning curve was performed by means of repeated measures two-way ANOVA, for detailed statistical analysis, see Results. B, C and D. Probe test performance. Quadrants are designated as follows: SE = the quadrant of the maze that contained the submerged escape platform during training, NE = the quadrant of the maze to the left of the training quadrant, SW = the quadrant of the maze to the right of the training quadrant. NW = the quadrant of the maze directly opposite to the training quadrant. B. % Time spent in the quadrant where the platform was placed during the training phase. C. Latency to reach the platform position for the first time. D. Gallangher's proximity test (mean proximity to former platform location). Data are shown as mean ± SEM. For detailed statistical analysis, see Results. * = p<0.05, ** = p<0.001 and *** = p<0.0001 saline-apoE4 vs. all other groups.

