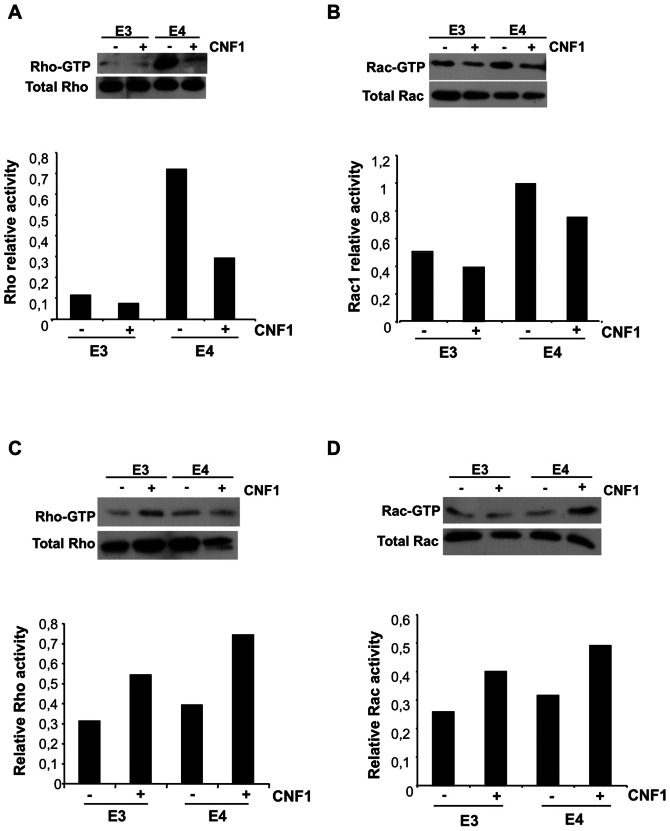
Figure 3. Modulation of Rho GTPases' activity by CNF1 in hippocampus and frontal cortex.
Immunoblots showing representative Pull down experiments (upper panels) were normalized as a function the total proteins loaded in the assay and the results expressed as relative activity (histograms, bottom panels). A, B. Pull down of Rho-GTP (A) and Rac-GTP (B) in hippocampus. C, D. Pull down of Rho-GTP (C) and Rac-GTP (D) in frontal cortex.

