
Figure 2. Impact of propofol on neurotrophins.
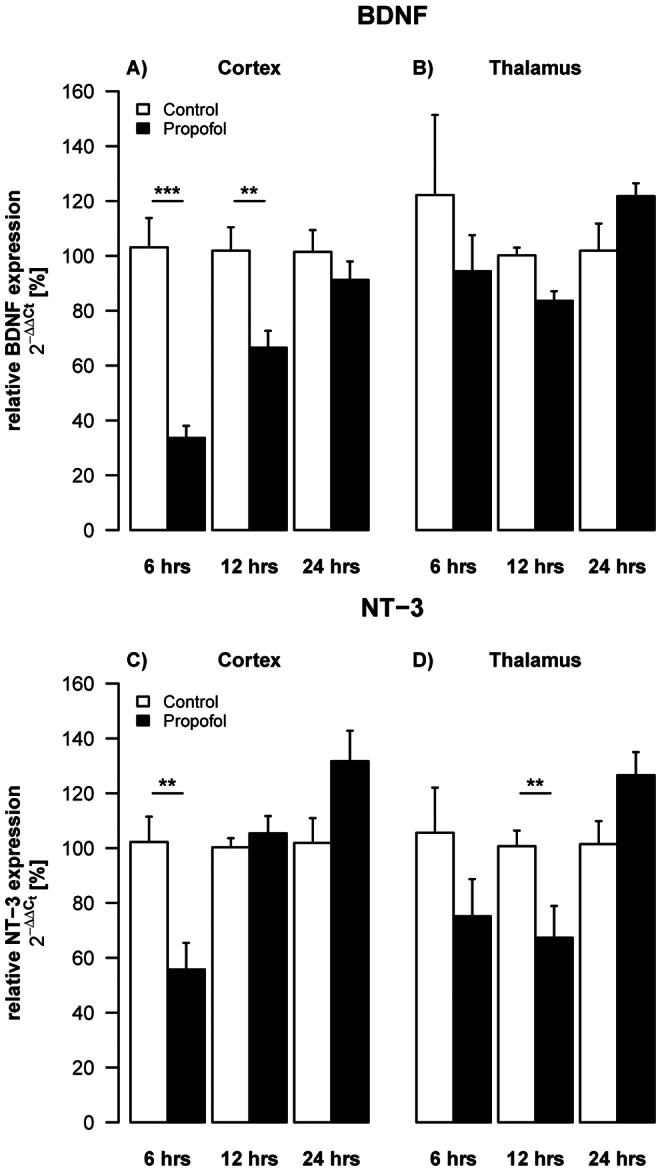
Densitometric quantifications of mRNA levels of BDNF and NT-3 in cortex and thalamus of P6 rats, analysed by qRT-PCR. Values represent mean normalised ratios of the densities of BDNF and NT-3 bands compared to the density of the control group (n = 6–7/point+SE). There was an effect of propofol treatment with a decrease of BDNF levels over time, which was significant after 6 hrs in the cortex [F(1,30) = 66.5, p<0.001]. There was also a decrease in NT-3 levels, which was significant in the cortex after 6 hrs [F(1,28) = 12.7, p = 0.004] and after 12 hrs in the thalamus [F(1,24) = 3.5, p = 0.06].