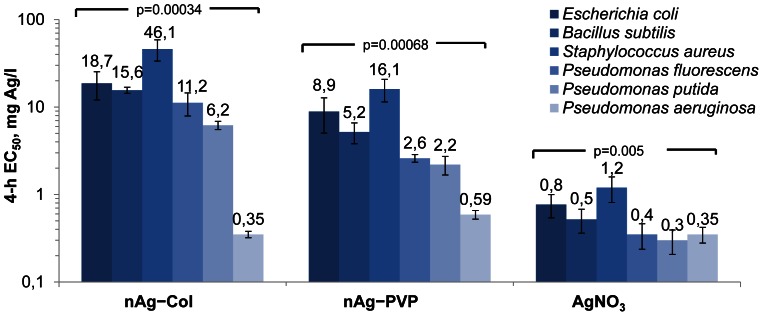
Figure 2. 4-h EC50 values (endpoint: growth inhibition; note the logarithmic scale) for different silver formulations to bacteria.
nAg-PVP states for PVP-coated AgNPs and nAg-Col for collargol. Concentrations are nominal. Data represent the average ± SD (n = 3), p-values denote statistically significant differences between different bacteria (ANOVA).

