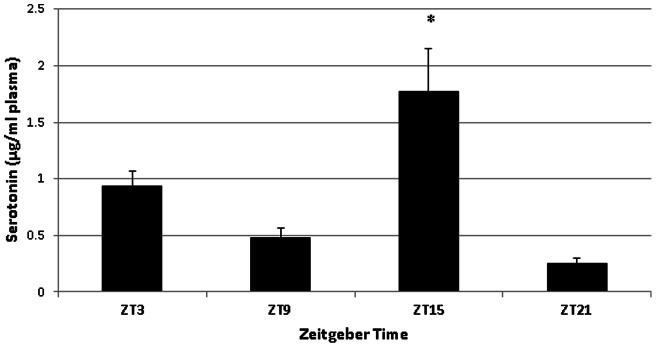
Figure 4. Serotonin content of blood plasma from laying hens (n = 6) in a 16:8 LD cycle.

Asterisk denotes time of day when serotonin levels were significantly different from serotonin content at other times of the day (F(3, 18) = 8.38, P<0.005), as determined by One-way ANOVA with Tukey's post-hoc analysis.
