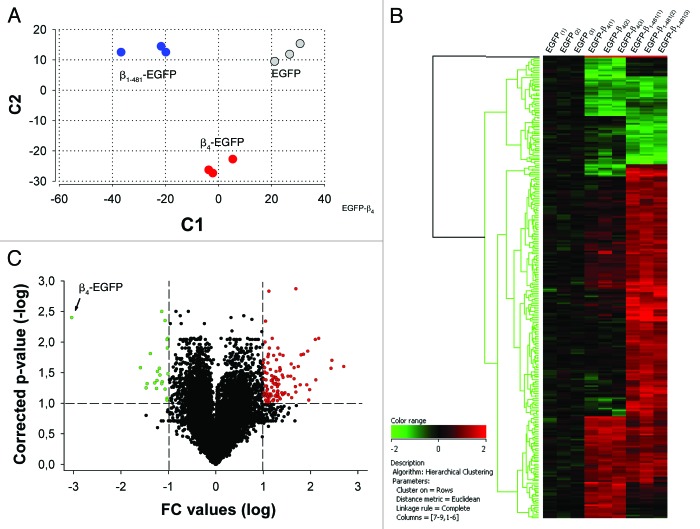
Figure 1.
Differential transcriptional activity evoked by expression of β4-EGFP or β1–481-EGFP. (A) Principal component analysis of global expression profiles from HEK293 transfected cells reveals distinct expression patterns in cells expressing wild-type β4-EGFP, β1–481-EGFP mutant and EGFP control using two parameters. The high quality of microarray hybridizations was determined using independent internal standards, the housekeeping β-actin and GADPH mRNAs. (B) Hierarchical clustering using 268 significantly regulated probe sets in β4-EGFP and β1–481-EGFP compared with EGFP control shows gene clusters with differential expression profiles linked to the 38 amino acids deletion. (C) Volcano Plot representing the distribution of all 55,000 probe sets according to fold-change and p-value from statistical comparison between β4-EGFP and EGFP, β1–481-EGFP and EGFP, β1–481-EGFP and β4-EGFP expressed in HEK293 cells. Probe sets with adjusted p-value < 0.1 and fold-change > 2 are in red while probe sets with fold-change < - 2 are in green.

