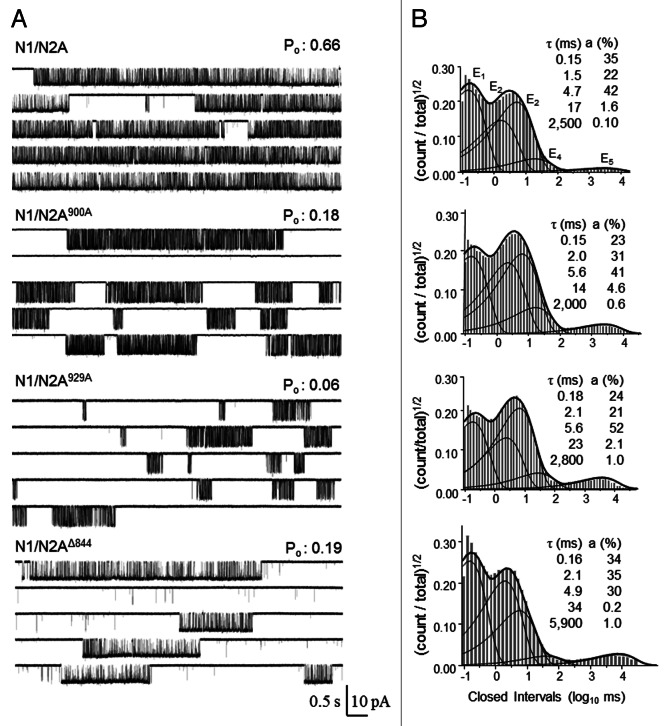
Figure 1. Gating and desensitization mechanism of N1/N2A900A and N1/N2A929A. (A) Representative traces (50 sec) of continuously recorded current from a cell-attached patch containing a single receptor exposed to high concentrations of Glu (1 mM) and Gly (0.1 mM). (B) Individual closed event histograms for entire files. Overlaid are fits to individual closed components (thin lines) and the probability density function (thick lines) calculated by fitting entire files to a kinetic model containing five closed and one open state. For each histogram, time constants (τ) and areas (a) for the five exponential closed components are indicated.

An official website of the United States government
Here's how you know
Official websites use .gov
A
.gov website belongs to an official
government organization in the United States.
Secure .gov websites use HTTPS
A lock (
) or https:// means you've safely
connected to the .gov website. Share sensitive
information only on official, secure websites.
