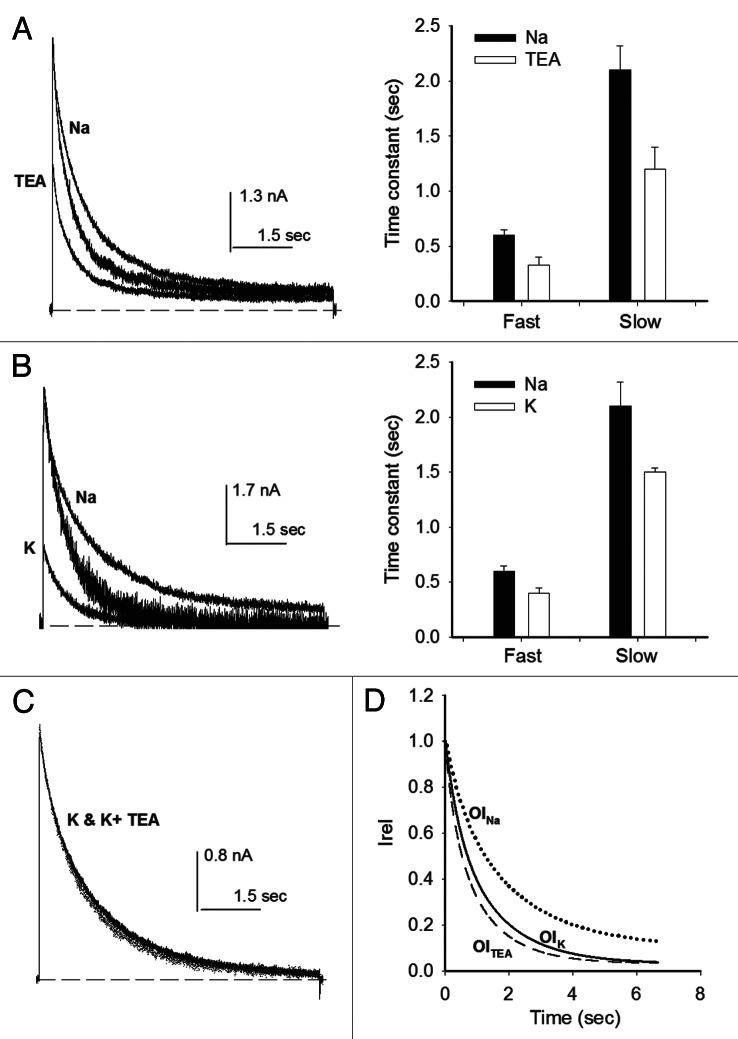
Figure 3. Effects of TEAo and Ko+ on OI. (A) Left panel, IK evoked by 0 mV/7sec pulse applied either in the absence (Nao) or in the presence of 15 mM TEAo, as indicated. Middle trace: IK with TEA scaled to control peak IK. OI follows the time course (Fig. 1): Ik(t)/Io = Af*exp(−t/τf,OI) + As*exp(−t/τs,OI) + C; Io is peak IK; τf,OI,TEA = 0.33 ± 0.07, τs,OI,TEA = 1.2 ± 0.22, AfTEA = 0.28 ± 0.07, AsTEA = 0.65 ± 0.07, CTEA = 0.06 ± 0.02. Right panel, inactivation time constants measured either in Nao or in 15 mM TEAo. TEAo significantly decreases both constants (p < 0.05). (B) Left panel, IK evoked by a +20mV/7sec pulse applied in either Nao or 100 Ko solutions, as indicated. Middle trace: IK in 100 Ko scaled to control peak IK. Right panel, inactivation time constants, as indicated. (C) Superposed IK recorded in either 100 mM K+o or in 100 K+o plus 15 mM TEAo. (D) OI time course. The lines are the least squares fit of OI of traces as in (A and B): 15TEA (dotted line, parameters as above, n = 6); 100 Ko (dashed line, n = 6): τf,OI,K = 0.4 ± 0.05 sec, τs,OI,K = 1.5 ± 0.04 sec, AfK = 0.34 ± 0.13, AsK = 0.64 ± 0.12, CK = 0.02 ± 0.008; Nao (solid line): τf,OI,Na = 0.6 ± 0.05sec, τs,OI,Na = 2.1 ± 0.22, AfNa = 0.3 ± 0.02, AsNA = 0.68 ± 0.03, CNa = 0.05 ± 0.01.

An official website of the United States government
Here's how you know
Official websites use .gov
A
.gov website belongs to an official
government organization in the United States.
Secure .gov websites use HTTPS
A lock (
) or https:// means you've safely
connected to the .gov website. Share sensitive
information only on official, secure websites.
