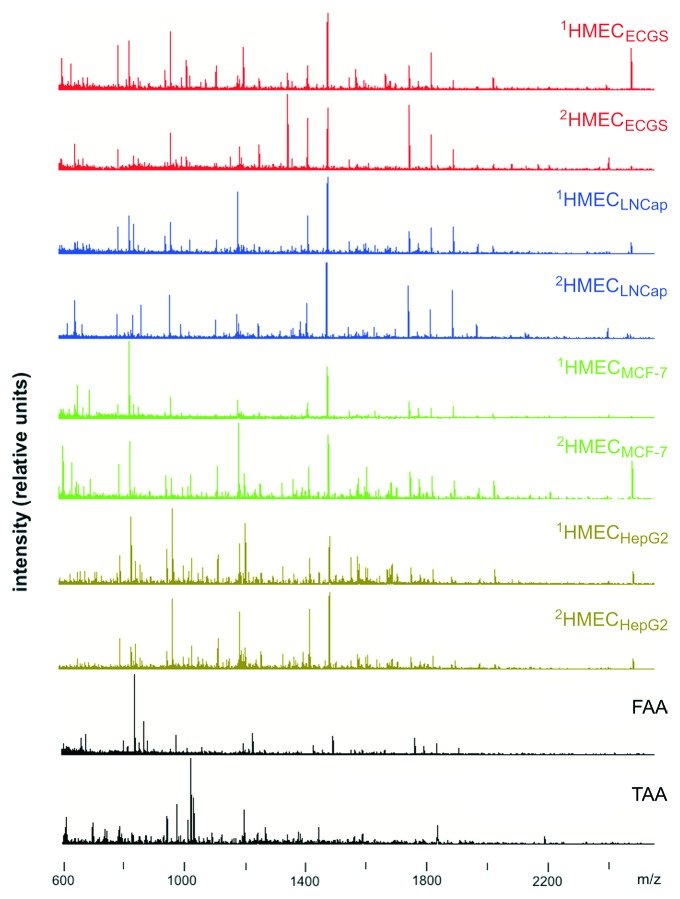
Figure 2. Mass spectra used to generate cell surface profiles. Representative spectra of EAA of HMEC obtained from donor 1 and donor 2 stimulated using endothelial cell growth supplement (1HMECECGS and 2HMECECGS), conditioned medium from MCF-7 cells (1HMECMCF-7 and 2HMECMCF-7), LNCap cells (1HMECLNCap and 2HMECLNCap), or HepG2 cells (1HMECHepG2 and 2HMECHepG2). Superscript numbers correspond to donor 1 or 2, respectively. The mass spectra of fibroblast-associated antigens (FAA) and tumor(MCF-7 cells)-associated antigens (TAA) are also shown.

An official website of the United States government
Here's how you know
Official websites use .gov
A
.gov website belongs to an official
government organization in the United States.
Secure .gov websites use HTTPS
A lock (
) or https:// means you've safely
connected to the .gov website. Share sensitive
information only on official, secure websites.
