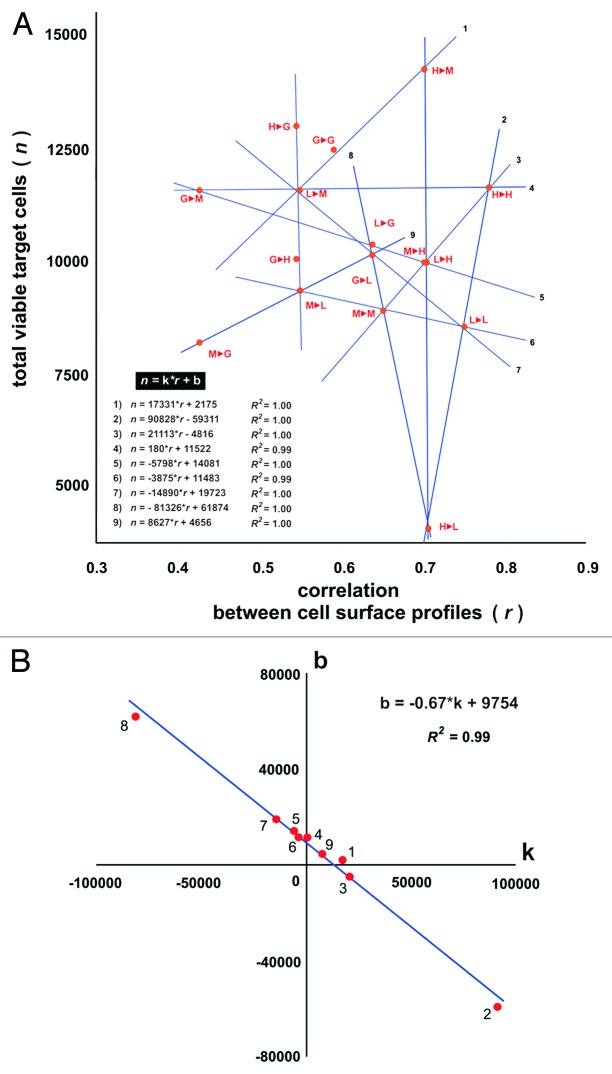
Figure 5. Cytotoxicity of effector CTLs against target HMEC plotted vs. correlation of cell surface profiles (A) and plotted coefficients of linear equations that describe the dependence of cytotoxicity from the correlation of cell surface profiles (B). (A) Autologous EC antigens were used to induce CTLs. The average number of viable target cells in 3 wells is presented. Accuracy of liner approximation (R2) was achieved using coordinates of 3 respective points. Equations for linear approximations are shown on the plot. Correlation values (coefficient r) were calculated for HMEC surface profiles used to generate antigens (EAA) for eliciting immune response and the surface profile of target HMEC used in same cytotoxicity assay. “1►2” – 1st letter corresponds to HMEC used to generate antigens (EAA) for eliciting immune response in the cytotoxicity assays; 2nd letter corresponds to the target HMEC used in the same cytotoxicity assay. “G” – 1HMECECGS; “M” – 1HMECMCF-7; “L” – 1HMECLNCap; “H” – 1HMECHepG2. (B) “k” and “b” values correspond to coefficients of linear equations showed on plot (A). Equation of linear approximation of the coordinates and accuracy of this approximation (R2) are shown on the plot.

An official website of the United States government
Here's how you know
Official websites use .gov
A
.gov website belongs to an official
government organization in the United States.
Secure .gov websites use HTTPS
A lock (
) or https:// means you've safely
connected to the .gov website. Share sensitive
information only on official, secure websites.
