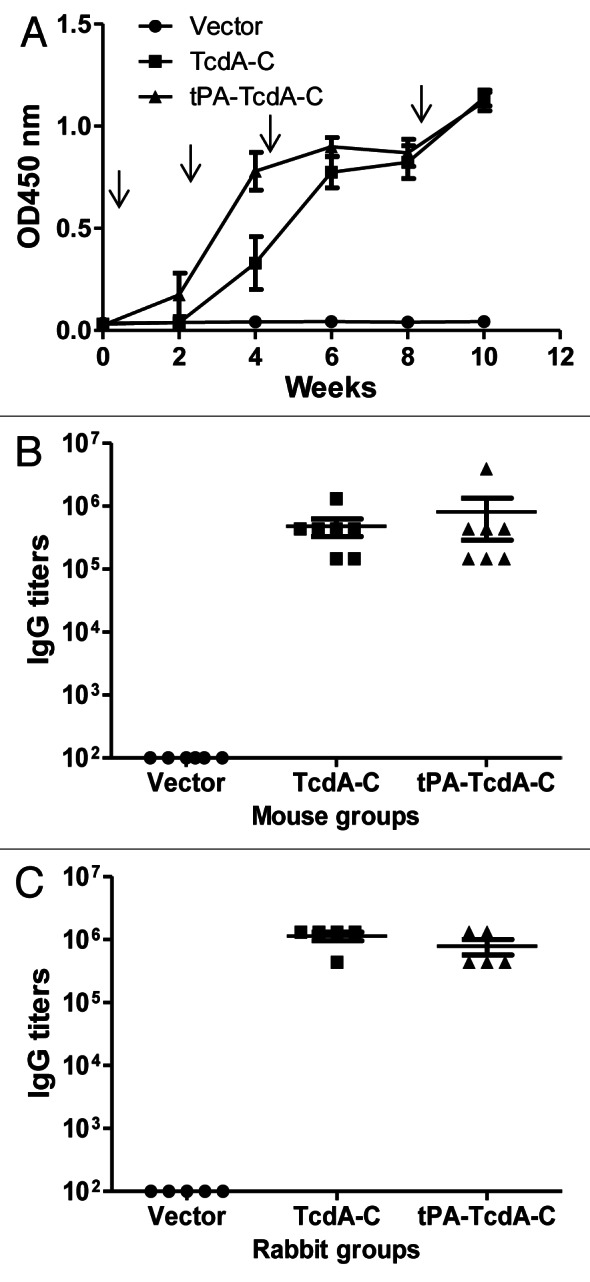
Figure 2. Antibody responses elicited by C. difficile toxin A DNA vaccines as measured by ELISA. (A) Temporal TcdA-C-specific antibody responses in mouse sera (1:500 dilution) receiving empty DNA vector pJW4303, TcdA-C DNA and tPA-TcdA-C DNA, respectively. Each curve represents the mean OD values plus standard deviation of antibody response for each mouse group. The arrows indicate the time points of DNA immunizations. (B) Peak level TcdA-C-specific IgG titers in individual mouse sera at two weeks after the 4th DNA immunization for different mouse groups. Each dot represents one animal. (C) Peak level TcdA-C-specific serum IgG titers in rabbits at two weeks after the 4th DNA immunization. Each dot represents one rabbit.
