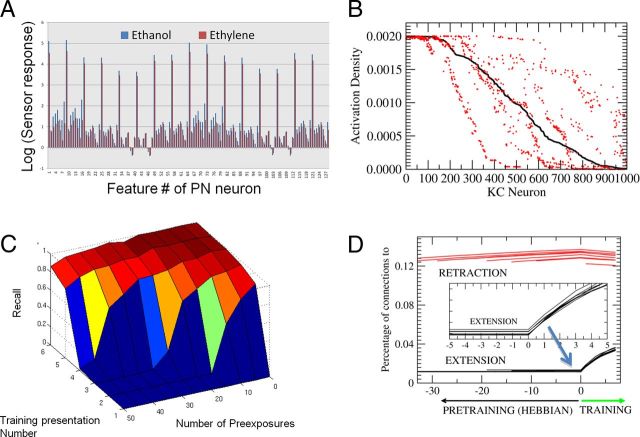
Figure 4.
LI using artificial sensor array data. A, Features obtained by the artificial sensor array made of metal-oxide sensors measuring ethanol and ethylene at various levels of concentrations ranging from 10 to 800 ppm. Each of the features are extracted from the time series recorded from the sensors reflecting the relative change and rates of change of the conductance levels in the sensors as described by Vergara et al. (2012). These data are available in at the UCI Machine Learning Repository (Vergara et al., 2012). B, Percentage of KCs that are activated for ethanol (black) and ethylene (red) for the complete dataset recorded in the sensor array. KC activity was ranked highest (left) to lowest (right) for responses to ethanol. Approximately 100 model KCs responded equally strongly to both ethanol and ethylene (left side of the x-axis). The remaining KC responses differentiated one odor from the other. In some cases the KC response to ethanol was higher than to ethylene (red dots below the black line), whereas in other cases the response to ethanol was lower than to ethylene (red dots above black). C, Recall measure solving the LI task in the model using the Hebbian rules described in the text. Note the qualitative similarities with Figure 1C; more pre-exposure reduces conditioning performance. D, Evolution of the percentage of connections to the extensor group and the retraction group for pre-exposures ranging from 0 to 50. The lines for the decreasing numbers of pre-exposures start farther to the right. All cells start at the same low connectivity. During pre-exposure the number of connections into the extensor group (black) becomes reduced because of the Hebbian rule. The connections to the retraction group (red), on the other hand, start spreading due to the repetitive coactivation of the retraction group neurons and the KCs. Once the conditioning protocol starts, the connections into the extension group are quickly reinforced, and connections to the retraction group are reduced. However, the starting points were a function of the number of pre-exposures. More pre-exposure produced fewer connections in the extension group and more connections in the retraction group. So the relative delay in conditioning with higher pre-exposures resulted from having to overcome the change in connections to both groups of ENs. In these simulations we used NKC = 5000, μ = 0.1, b is dynamically set to reach activity levels of 5% in the KCs as indicated by (Huerta and Nowotny, 2009), the positive and negative learning rates p+ = 0.1 (but they can be varied) and p− = 0.05; see more details by Huerta and Nowotny, 2009). Note that there is a broad range of parameter values that lead to very similar qualitative results.

