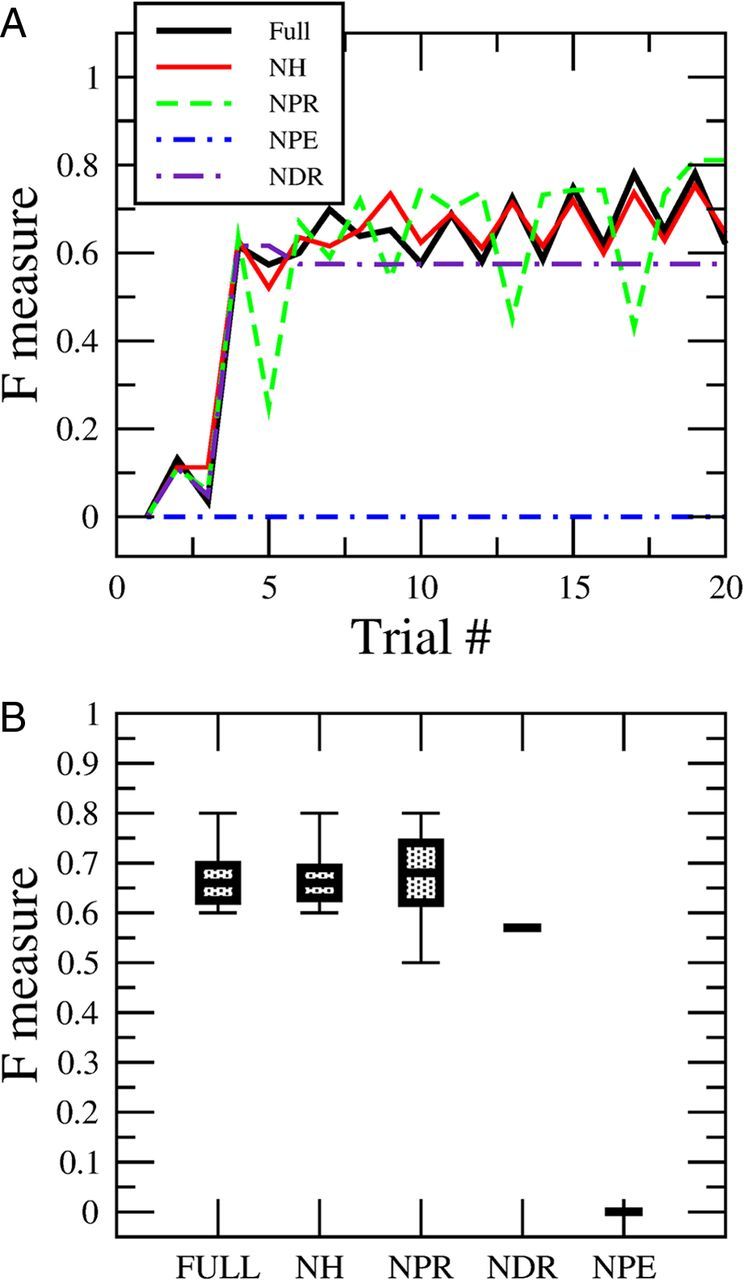
Figure 6.

Dissection of the impact that different learning rules have on performance in solving the discrimination task. A, Evolution of the performance in the discrimination task between ethanol and ethylene as a function of the number of presentations during single runs of the model. The black line (full) shows the performance using the full set of rules. The red line (NH) shows the performance by eliminating the pure Hebbian rule, which is Rule 1. The green line (NPR) shows the performance by eliminating the condition that activates connections into the retraction group in the Rule 3. The blue line (NPE) eliminates the positive reinforcement to the extensor group in Rule 2, which blocks learning completely. And finally the violet curve shows the performance by eliminating the condition that removes the connections into the retraction group (NDR) in Rule 3. B, The same as A, but taking the steady state reached after 20 presentations of learning. We also have the error calculated by running the simulations 10 times. We used the same parameter values as in Figure 4.
