
Fig. 9.
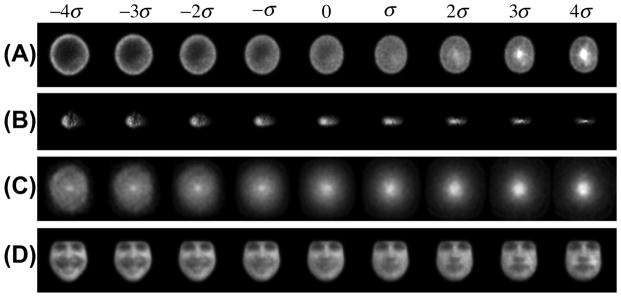
Modes of discrimination computed using the penalized LDA method in combination with the LOT framework. Each row contains the mode of variation that best discriminates the two classes in each dataset. Parts (A),(B),(C),(D) refer to discrimination modes in nuclear morphology, golgi proteins, galaxy morphology, and facial expression datasets, respectively.