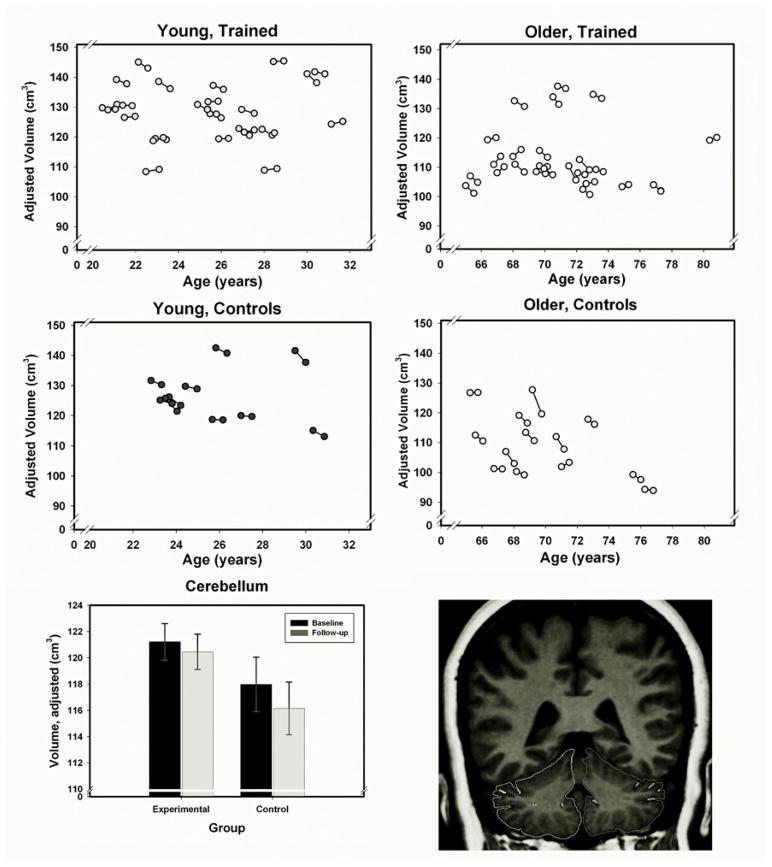
Figure 1.
Cerebellar volume in experimental (trained) and control groups at baseline and follow-up. Top four panels – spaghetti plots of cerebellar volume adjusted for the intracranial volume as a function of baseline age. Lower panel – mean cerebellar volumes (with ± SE, standard error bars) at baseline and follow-up for participants who underwent cognitive training and controls. Volumes of cerebellar hemispheres include the cortex, the white matter, and the deep nuclei were traced as shown.

