
Figure 1. Enrichment of non-synonymous de novo variants in probands compared with sibling controls.
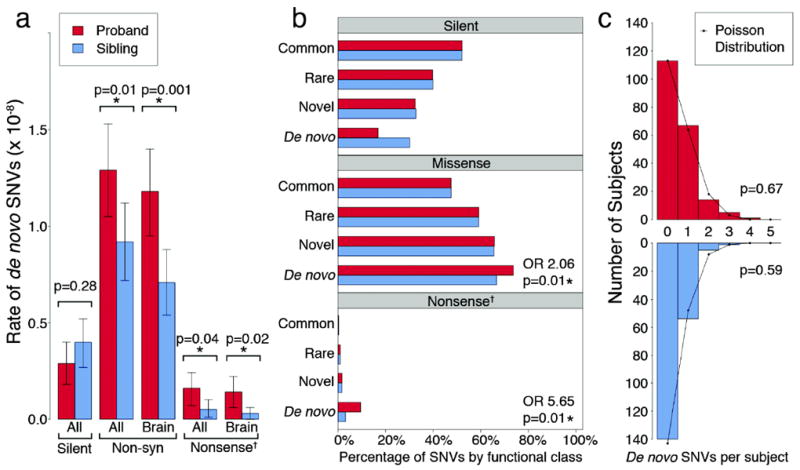
a) The rate of de novo variants is shown for 200 probands (red) and matched unaffected siblings (blue). ‘All’ refers to all RefSeq genes in hg18, ‘Brain’ refers to the subset of genes that are brain-expressed23 and ‘Non-syn’ to non-synonymous SNVs (including missense, nonsense and splice site SNVs). Error bars represent the 95% CI and p-values are calculated with a two-tailed binomial exact test. b) The proportion of transmitted variants in brain-expressed genes is equal between 200 probands (red) and matched unaffected siblings (blue) for all mutation types and allele frequencies, including common (≥1%); rare (<1%), and novel (single allele in one of the 400 parents); in contrast both non-synonymous and nonsense de novo variants show significant enrichment in probands compared to unaffected siblings (73.7% vs. 66.7%, p=0.01, asymptotic test and 9.5% vs. 3.1%, p=0.01 respectively). c) The frequency distribution of brain-expressed non-synonymous de novo SNVs is shown per sample for probands (red) and siblings (blue). Neither distribution differs from the Poisson distribution (black line) suggesting that multiple de novo SNVs within a single individual do not confirm ASD risk.
† ‘Nonsense’ represents the combination of nonsense and splice site SNVs.