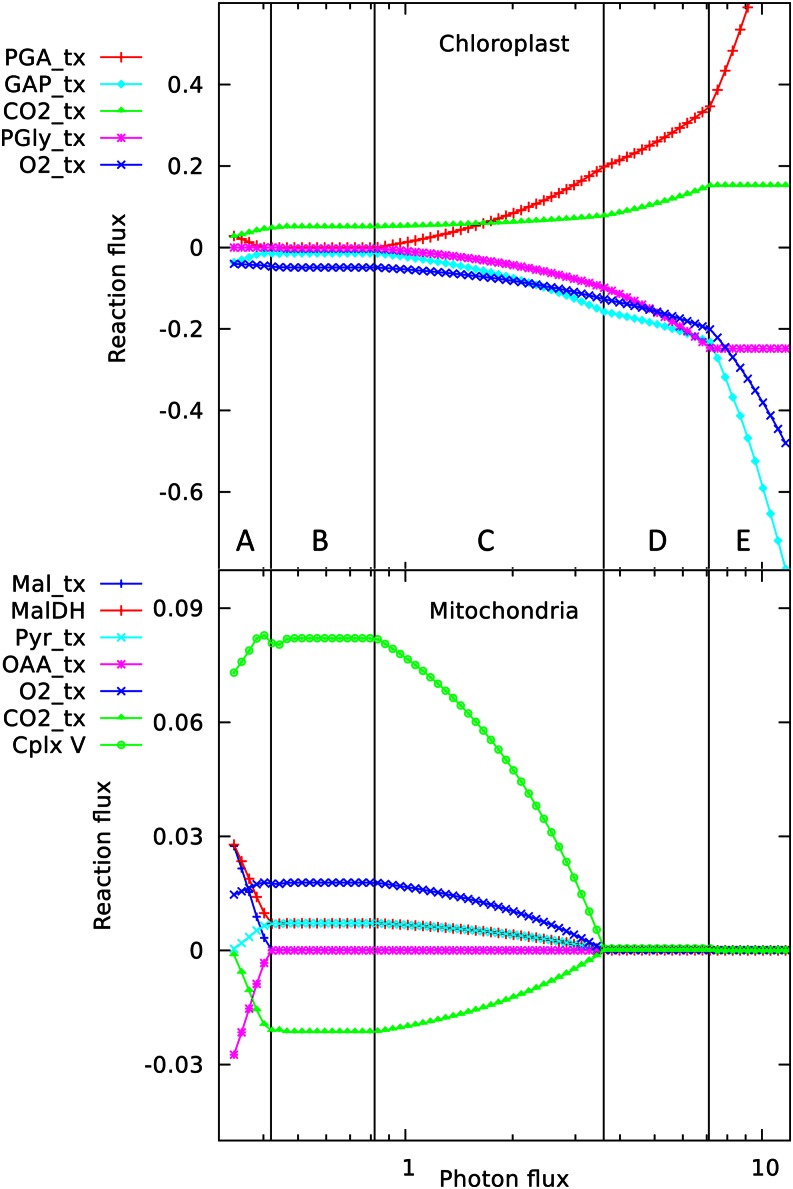
Figure 2.
Responses of solutions in the chloroplast and mitochondrion to varying photon fluxes. Suffix _tx indicates transport of the named metabolite, positive values represent import to the compartment, and negative values represent export. The abscissa is plotted as a logarithmic scale to enable the full set of responses to be easily seen; this causes the reaction responses to appear as curves, whereas they vary linearly with light intensity, showing abrupt changes in slope where the pattern of fluxes changes. The four major flux rearrangements are indicated by vertical lines dividing the flux patterns into five major regions labeled A to E. The transition between regions A and B is shown at higher magnification in Figure 3. PGA, phosphoglycerate; GAP, glyceraldehyde 3-P; PGly, phosphoglycolate; Mal, malate; MalDH, malate dehydrogenase; Pyr, pyruvate; OAA, oxaloacetate Cplx V, complex v.

