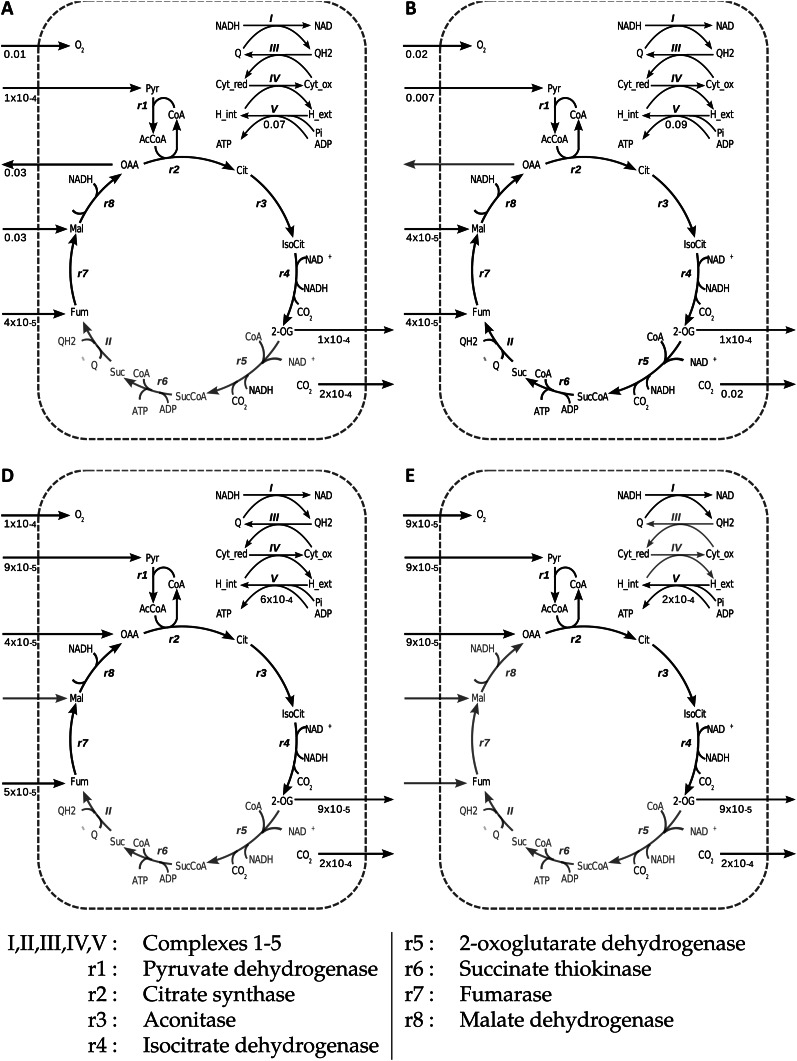
Figure 4.
Flux distributions in the mitochondrial module at various photon fluxes. Results are shown for specific flux values in the labeled regions as follows: A, 0.3; B, 0.8; D, 4.0; and E, 8.0. State C (not shown) is intermediate between B and D. Flux figures are rounded to 1 significant figure for clarity. Reactions that are grayed out carry zero flux. In state B, all reactions are active, and this then describes the structure of the mitochondrial module. I, Complex 1; II, complex 2; III, complex 3; IV, complex 4; V, complex 5; r1, pyruvate dehydrogenase; r2, citrate synthase; r3, aconitase; r4, isocitrate dehydrogenase; r5, oxoglutarate dehydrogenase; r6, succinate thiokinase; r7, fumarase; r8, malate dehydrogenase; Cyt_red, cytochrome reduced; Cyt_ox, cytochrome oxidized; Q, ubiquinol; QH2, ubiquinone; OAA, oxaloacetate; Mal, malate; Fum, fumarate; Suc, succinate; SucCoA, succinyl CoA; IsoCit, isocitrate; Cit, citrate; H_int, internal proton; H_ext, external proton; AcAoA, acetyl-coA.

