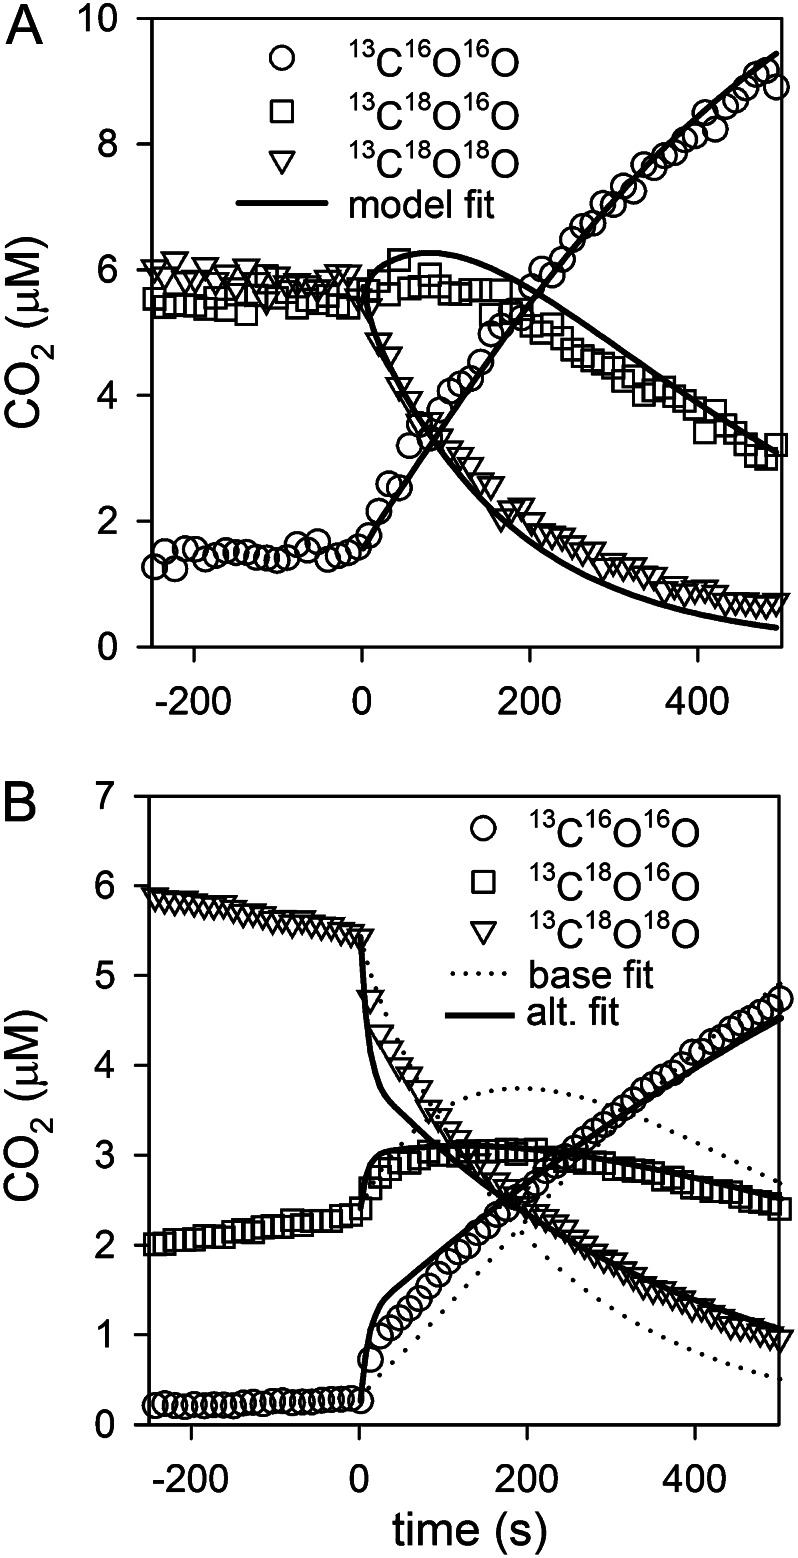
Figure 2.
Sample model fits to 18O-CO2 data for the determination of eCA activity. Cells expressing eCA were added to the assay solution at time 0, accelerating 18O removal. A shows a good fit to the data. B shows an example where a better fit can be achieved by reducing fb-BL 10-fold, but the eCA activities are similar in both fits (base, ksf = 1.7 × 10⁻⁶; reduced, fb-BL ksf = 1.5 × 10⁻⁶). For clarity, only every other 18O-CO2 data point is shown.

