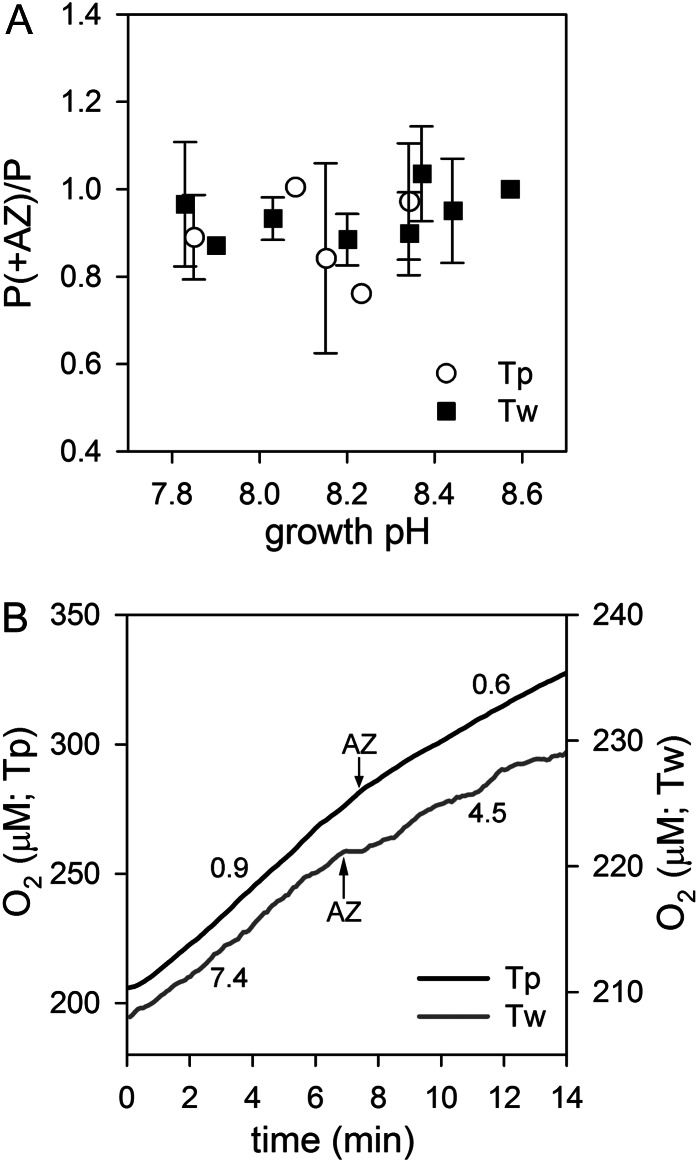
Figure 6.
Effect of the eCA inhibitor AZ on photosynthesis. A, Effect of short-term inhibition of eCA on photosynthesis shown as the ratio of the photosynthetic rate in the presence of the inhibitor (P+AZ) to the rate without the inhibitor (P). The diatoms (T. pseudonana [Tp] and T. weissflogii [Tw]) were grown and assayed at a range of pHs with constant Ci (2 mm). B, Oxygen traces showing inhibition of photosynthesis at 1 μm CO2 after the addition of AZ. The numbers next to the traces indicate the rate of oxygen production (×10−17 mol cell−1 s−1) before and after AZ addition.

