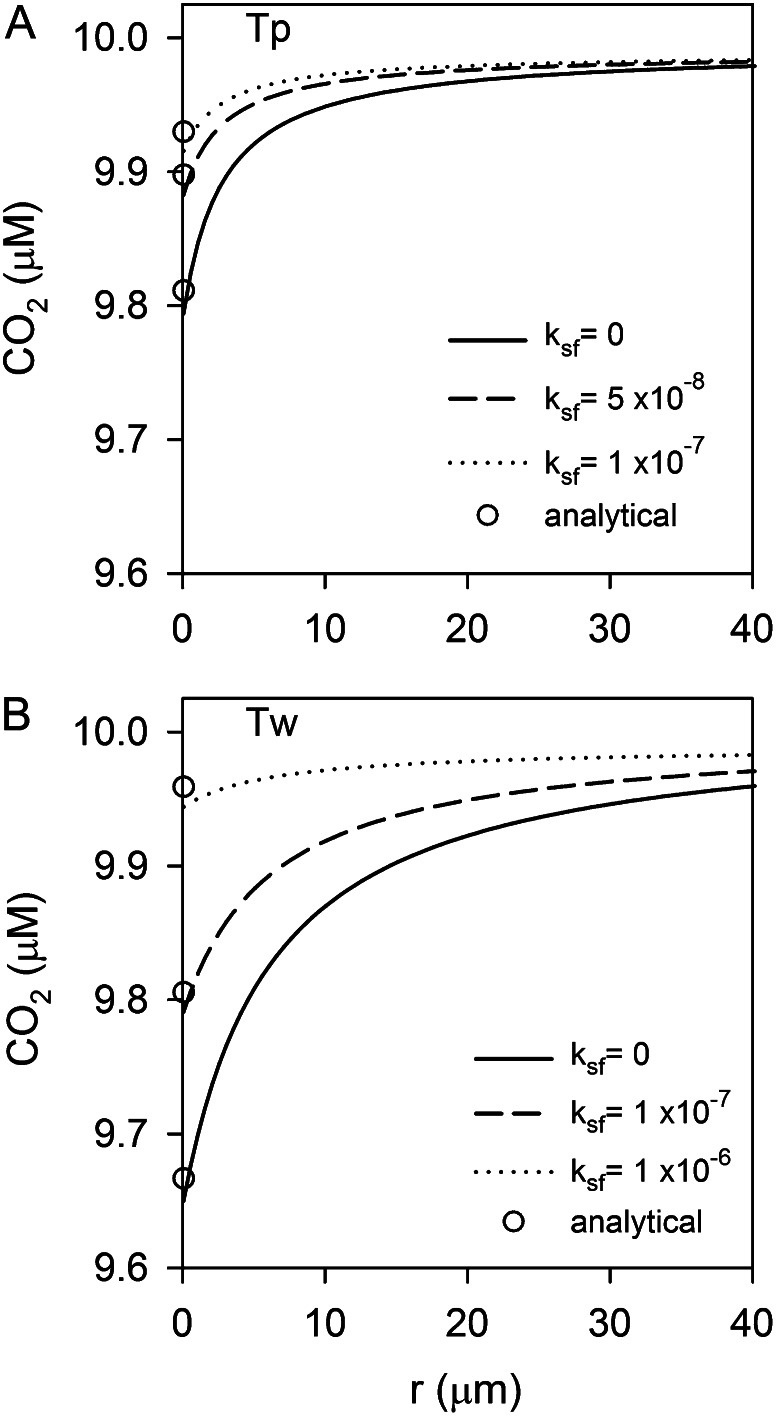
Figure 7.
Model simulations of the effect of eCA on surface boundary-layer chemistry during CO2 uptake. (A, T. pseudonana [Tp]; B, T. weissflogii [Tw]). The effect of eCA on the CO2 profiles is shown at two eCA activities, the lower at a magnitude similar to fc-BL and the higher approximating maximal expression levels. ksf values used in the simulations are indicated. Analytical approximations for surface CO2 concentrations obtained using Equation 12 are indicated with white circles, agreeing well with the numerical solution.

