Figure 4.
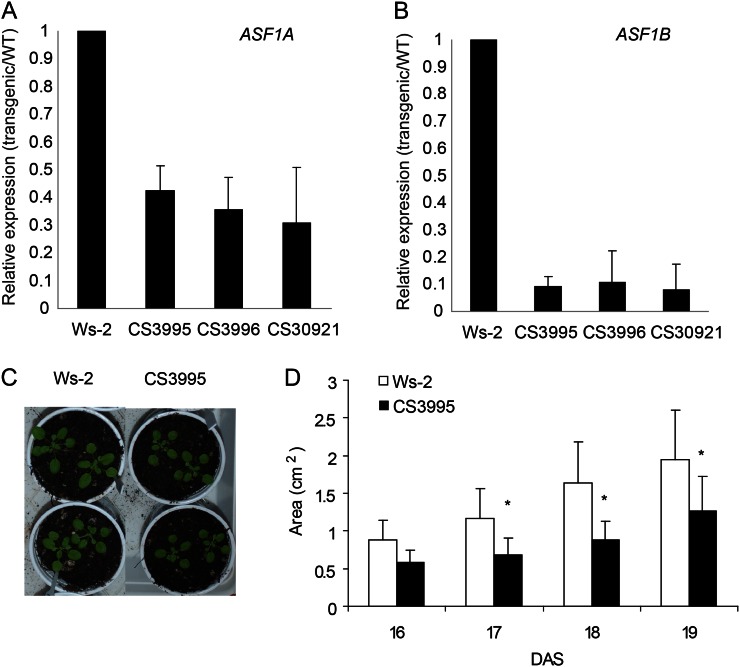
A and B, Relative transcript levels of Arabidopsis ASF1A (A) and ASF1B (B) measured by qRT-PCR in wild-type (WT) plants (Wassilewskija [Ws-2]) and in asf1a/asf1b RNAi transgenic plants (lines CS3995, CS3996, and CS30921). C and D, Comparison of the rosette area in wild-type and asf1a/asf1b RNAi transgenic plants from 16 to 19 DAS. Asterisks indicate the statistical differences applying Student’s t test (P < 0.05). [See online article for color version of this figure.]

