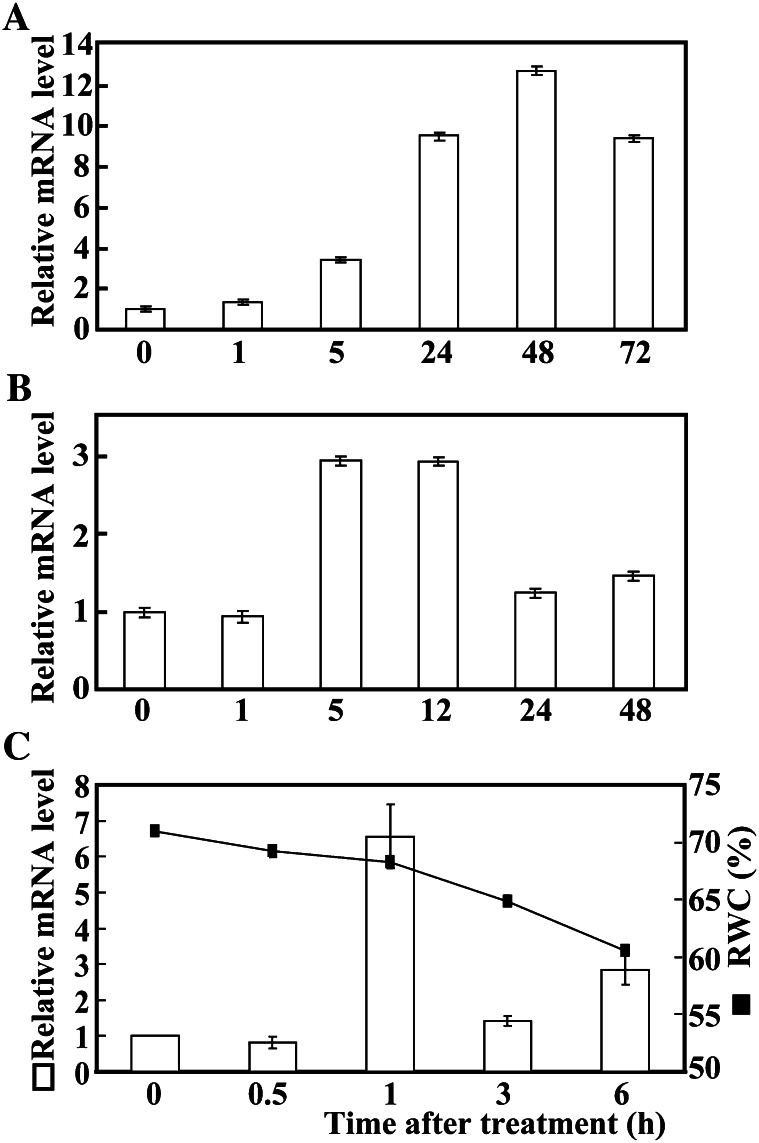
Figure 1.
Time-course expression analysis of PtrbHLH under various stress treatments. A, Expression of PtrbHLH under cold stress for 0, 1, 5, 24, 48, and 72 h. B, Expression of PtrbHLH under salt stress for 0, 1, 5, 12, 24, and 48 h. C, Expression of PtrbHLH and relative water content (RWC) under dehydration stress (25°C and relative room humidity of 44%) for 0, 0.5, 1, 3, and 6 h. Error bars for qPCR analysis stand for sd based on four replicates. Relative water content analysis was repeated twice with three replicates.

