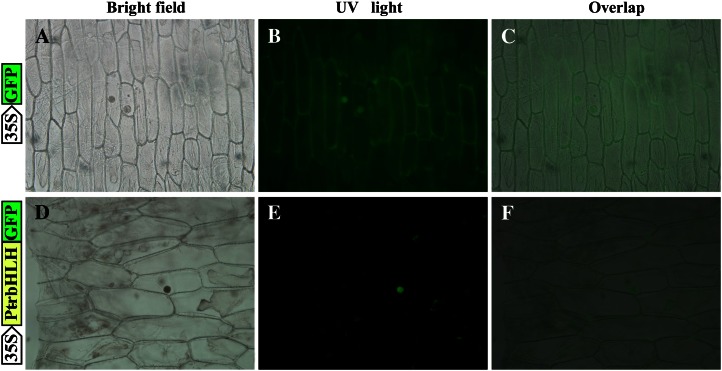
Figure 2.
Subcellular localization analysis of PtrbHLH. The PtrbHLH-GFP fusion protein and GFP (used as a control), driven by CaMV 35S, were separately transformed into onion epidermal cells and visualized by fluorescence microscopy. Images were taken in the representative cells expressing GFP (A and B) or the PtrbHLH-GFP fusion protein (D and E) under bright field (A and D) or dark field (B and E). The merged images are shown in C and F, respectively. [See online article for color version of this figure.]

