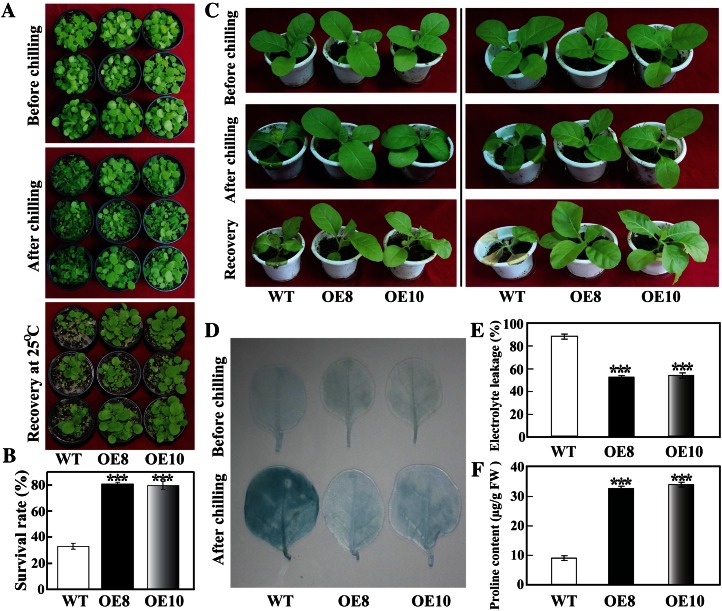
Figure 3.
Cold tolerance assay of transgenic tobacco plants overexpressing PtrbHLH. A, Phenotypes of 30-d-old transgenic plants (OE8 and OE10) and the wild type (WT) before and after chilling treatment (0°C for 23 h), followed by recovery in an ambient environment for 10 d. B, Survival rates of the transgenic and wild-type plants after recovery from chilling treatment. The survival rate is the ratio of the number of live plants and the total number of plants tested under stress. C, Phenotypes of 60-d-old transgenic and wild-type plants before/after chilling treatment and after recovery. D, Cell death analysis of the leaves via trypan blue staining before and after chilling treatment. E and F, Electrolyte leakage (E) and Pro content (F) in wild-type and transgenic plants measured after chilling treatment. FW, Fresh weight. Asterisks indicate significant differences between the transgenic lines and the wild type (***P < 0.001). [See online article for color version of this figure.]

