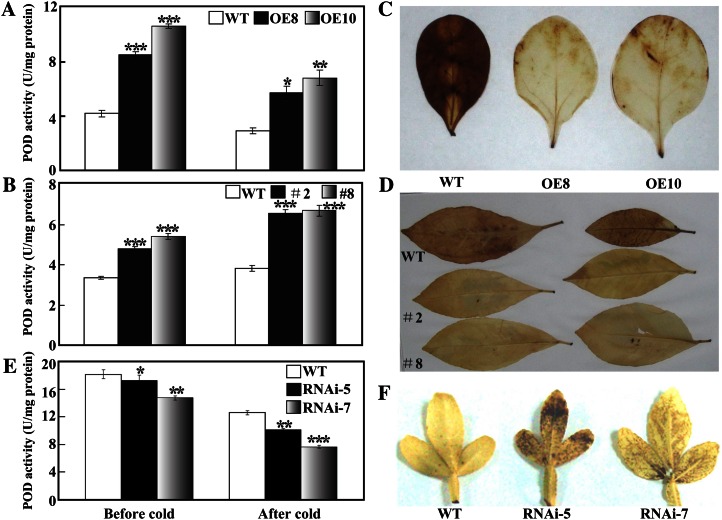
Figure 5.
Analysis of POD activity and H2O2 accumulation in the transgenic plants. A to D, POD activity (A and B) and H2O2 accumulation (C and D) in transgenic tobacco (A and C) and lemon (B and D) plants overexpressing PtrbHLH before and after cold treatment, in comparison with the corresponding wild type (WT). E and F, POD activity (E) and H2O2 accumulation (F) in cold-treated leaves collected from the wild type and trifoliate orange RNAi lines. Asterisks indicate significant differences between the transgenic lines and the wild type under the same conditions (*P < 0.05, **P < 0.01, ***P < 0.001). [See online article for color version of this figure.]

