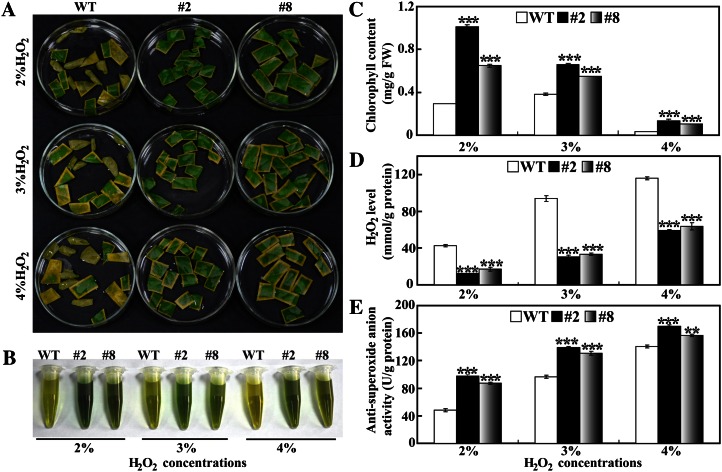
Figure 8.
Oxidative stress tolerance assay of transgenic lemon. A, Representative photographs showing leaf pieces of transgenic (#2 and #8) and wild-type (WT) plants after H2O2 treatment. B and C, Chlorophyll extraction solutions (B) and chlorophyll contents (C) in leaf pieces of transgenic and wild-type plants. FW, Fresh weight. D and E, Endogenous H2O2 contents (D) and antisuperoxide anion activity (E) in leaf pieces of transgenic and wild-type plants. Asterisks indicate significant differences between the transgenic lines and the wild type under the same treatment (**P < 0.01, ***P < 0.001). [See online article for color version of this figure.]

