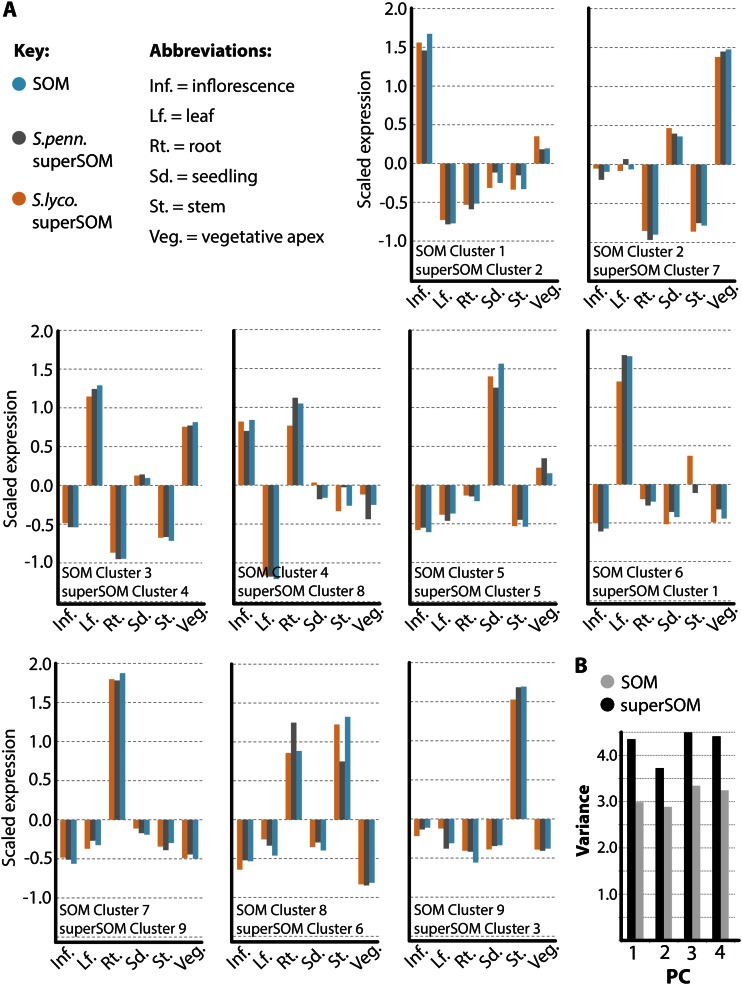
Figure 2.
Correspondence between SOM and superSOM results. A, Codebook vector values representing the identities of SOM and superSOM clusters used in this study. SOM and superSOM clusters correspond based on their overall expression profiles and positions in PC space (Fig. 1). Codebook vectors representing SOM clusters (blue) and superSOM clusters (S. lycopersicum [S.lyco.] in orange and S. pennellii [S.penn.] in gray) exhibit high correlation. B, Comparison of the sum of variances for PCs explaining variation in gene expression across clusters using SOM and superSOM approaches. As expected, because orthologs are forced to occupy the same cluster in a superSOM approach, superSOM cluster members exhibit higher variance in gene expression relative to SOM clusters. Inf., Inflorescence; Lf., leaf; Rt., root; Sd., seedling; St., stem; Veg., vegetative apex. [See online article for color version of this figure.]

