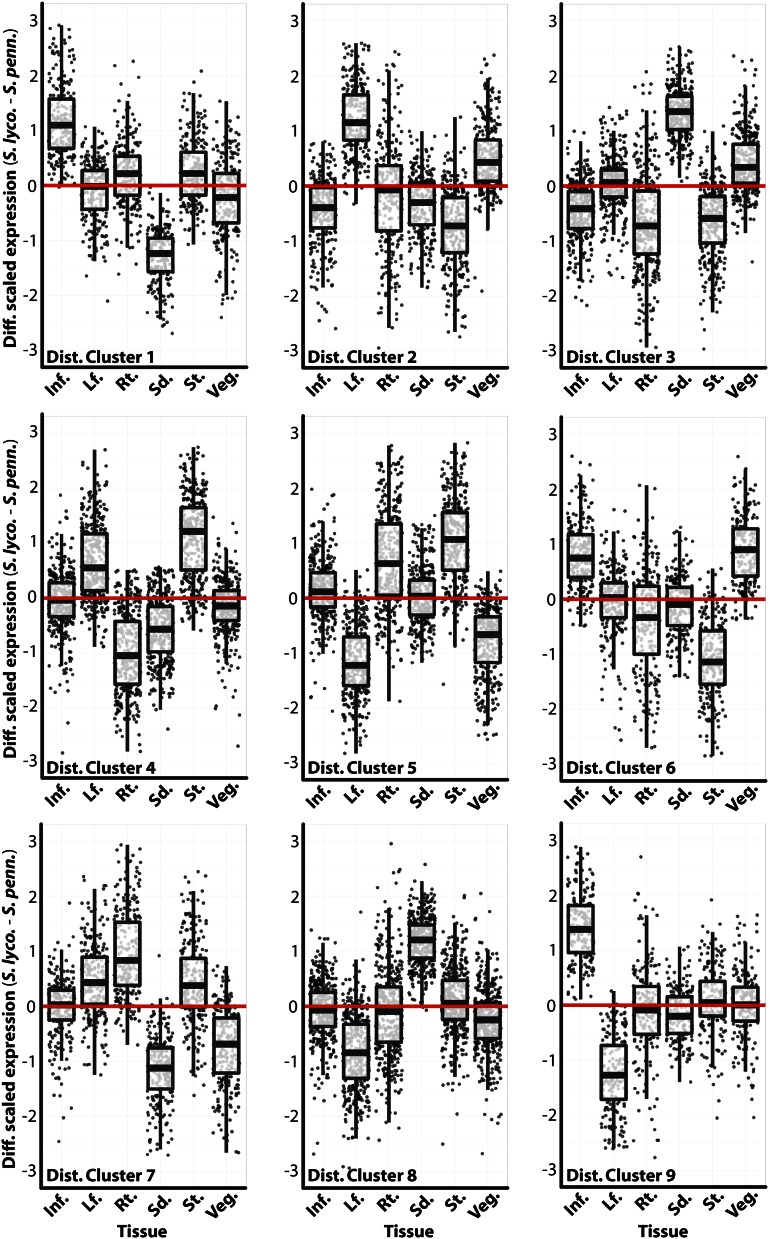
Figure 7.
Changes in gene expression between species by tissue, in clusters grouped by change in gene expression profile. For distance clusters (Fig. 6) that possess genes with similar displacement in PC space, the difference in scaled gene expression values between species (S. lycopersicum [S. lyco.]–S. pennellii [S. penn.]) for each tissue is shown. For example, distance cluster 9 genes show higher expression in the inflorescence and lower expression in leaves in S. lycopersicum compared with S. pennellii. Relevant genes in each cluster, the biology of which are reflective of the gene expression pattern, are discussed in the text. Inf., Inflorescence; Lf., leaf; Rt., root; Sd., seedling; St., stem; Veg., vegetative apex. [See online article for color version of this figure.]

