Figure 6.
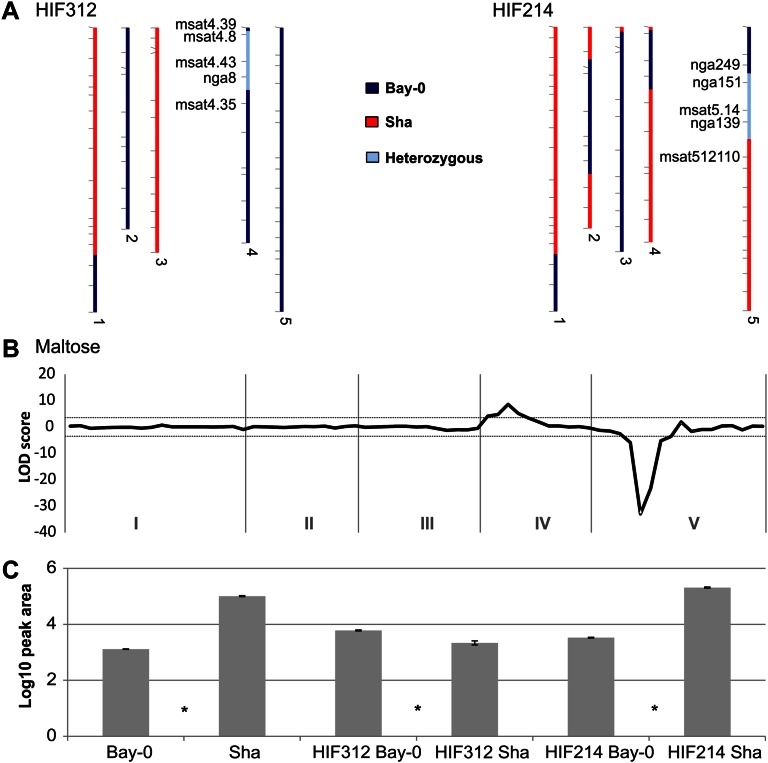
QTL confirmation for maltose using the HIF approach. Two QTL regions (top chromosome 4 and top chromosome 5) were analyzed using AR seeds of lines HIF312 and HIF214 (A). The QTL profile for maltose (B) shows two significant QTLs (dashed line indicates the LOD 4 significance threshold). The lower section (C) shows the parental levels for maltose and the confirmation for both QTLs by the segregating HIF lines (either fixed for Bay-0 or Sha alleles at the heterozygous interval). Significant differences (Student’s t test, P < 0.05) are indicated with an asterisk in between the two contrasting samples.

