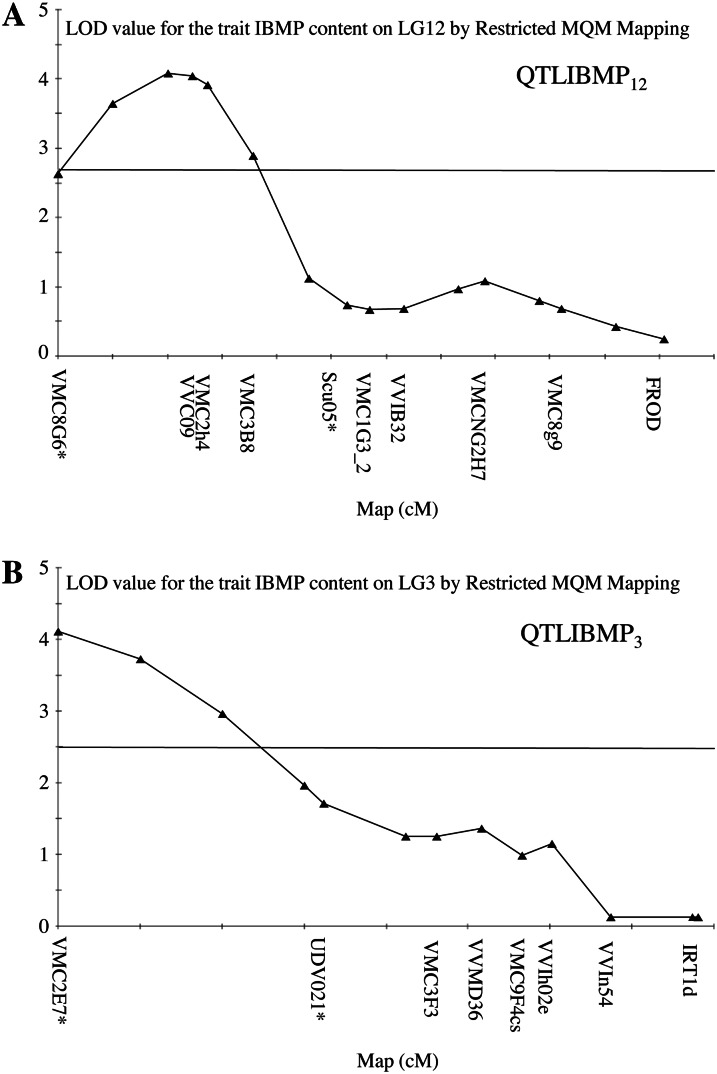
Figure 2.
LOD score plots for IBMP QTLs on LG3 and LG12. A, QTLIBMP12, QTL located on LG12. B, QTLIBMP3, QTL identified on LG3. QTLs were detected on the F1 CS × RGM mapping population on the consensus map. Asterisks indicate flanking markers used to identify the corresponding genomic regions on chromosome 3 and 12 sequences. The horizontal axis is graduated every 5 centimorgans (cM). The horizontal line indicates the minimum LOD score retained for QTLs detection at the LG level (P = 0.05).

