
Figure 5.
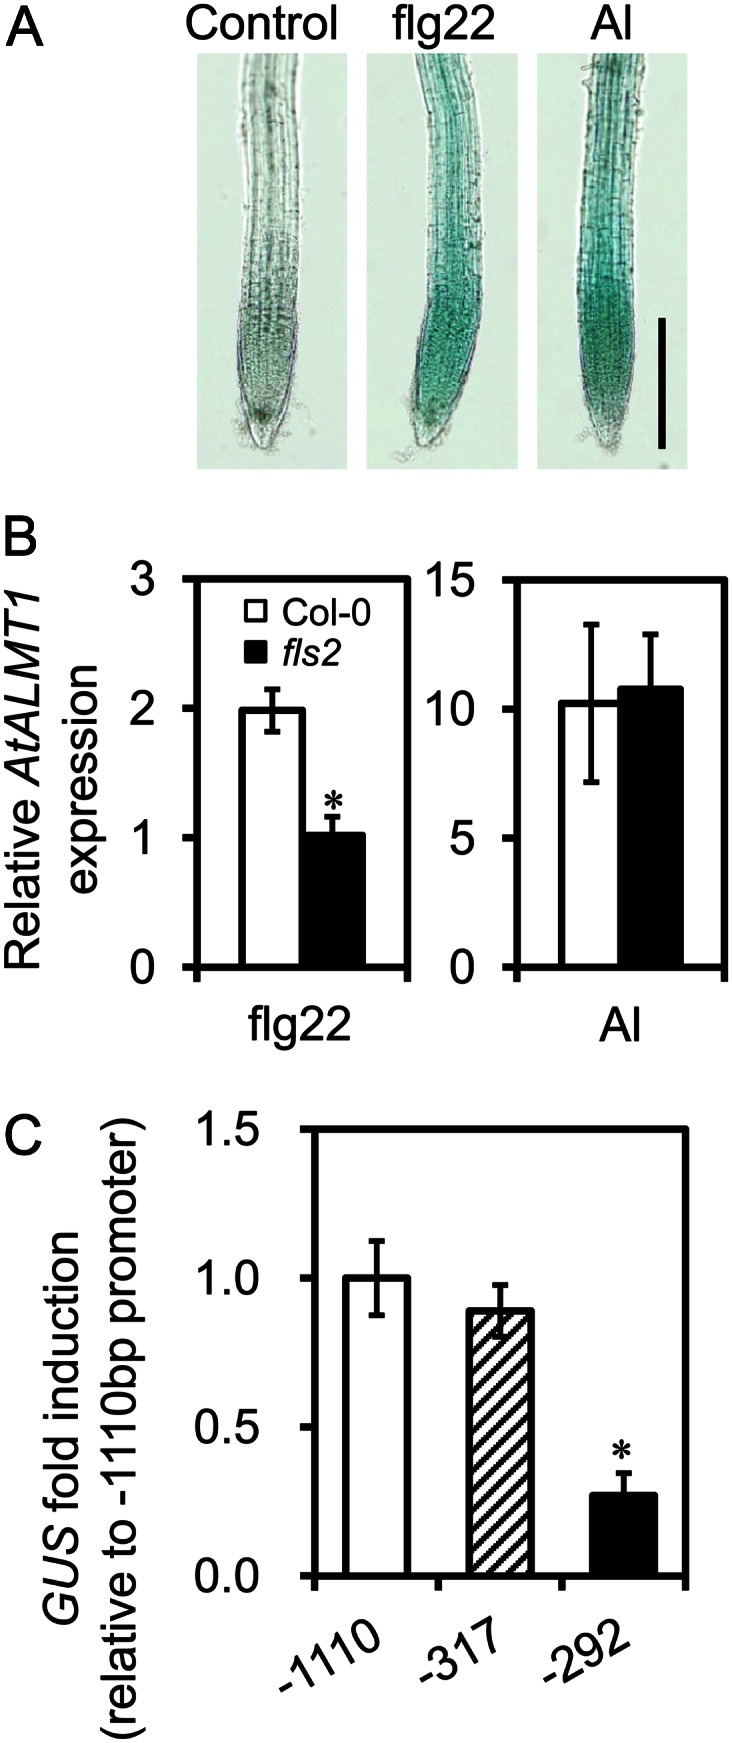
AtALMT1 transcription and GUS expression in roots treated with flg22. A, Induction of AtALMT1 by flg22 in transgenic Arabidopsis carrying AtALMT1promoter::GUS constructs. The images show GUS staining in roots after 6 h of treatment with flg22 (10 μm) and AlCl3 (10 μm). Bar = 20 μm. B, AtALMT1 transcript levels in roots of the flg22 signaling mutant fls2 and the wild type (Col-0) incubated for 6 h with or without flg22 (10 μm) or AlCl3 (10 μm). Values are means ± sd (n = 3). The asterisk indicates a significant difference from the Col-0 transcript level (P < 0.05, Student’s t test). C, Transcript levels of GUS in −1,110, −317, and −292 bp AtALMT1promoter:GUS transgenic plants analyzed by real-time quantitative RT-PCR. Roots of seedlings were treated with 10 μm flg22 for 6 h. GUS transcript levels were normalized to that of UBQ1, and then fold change (treatment/control) was calculated for each line. Relative fold change (the relative value of each line to mean fold change of the −1,110 bp AtALMT1 promoter construct) was calculated. Values are means ± se (n = 3). The asterisk represents a significant difference from the −1,110 bp promoter construct (P < 0.05, Student’s t test).