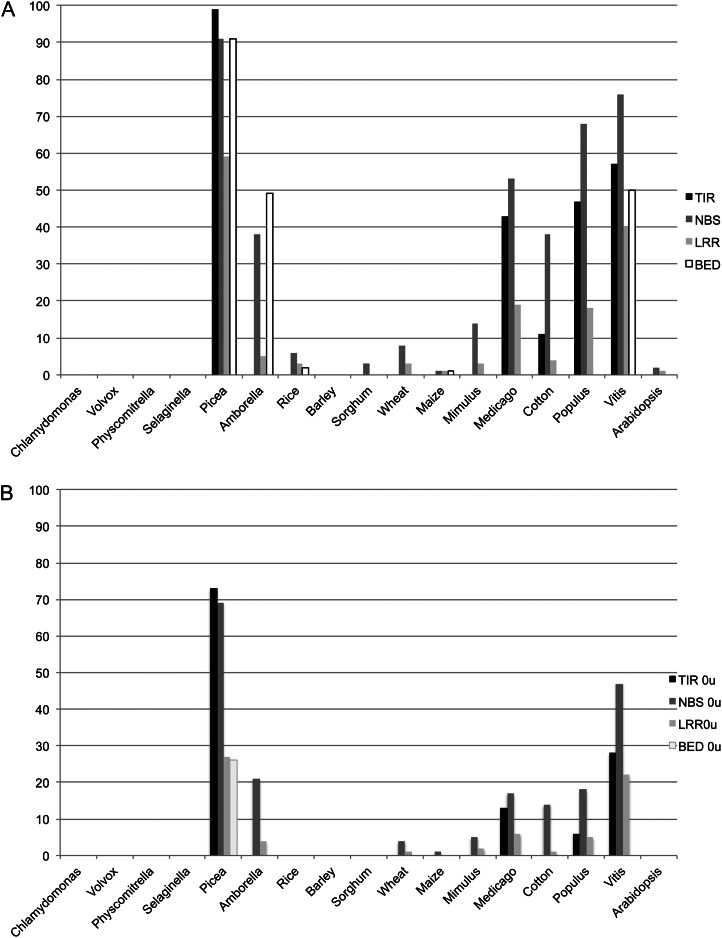
Figure 9.
Percentage of NBS-LRR-type genes hit by more than 10 unique sRNA reads in different plant species. For each species, genes that contained any of TIR, NBS, LRR, or BED domains were selected, and for each class, the percentage of those genes that were hit by more than 10 different unique 21-nt sRNA sequences was calculated. In the top graph, sRNA reads were mapped allowing one mismatch, and reads mapping at multiple positions in the whole reference were retained. In the bottom graph, mapping was performed with only perfect matches and discarding reads mapping to multiple positions.

