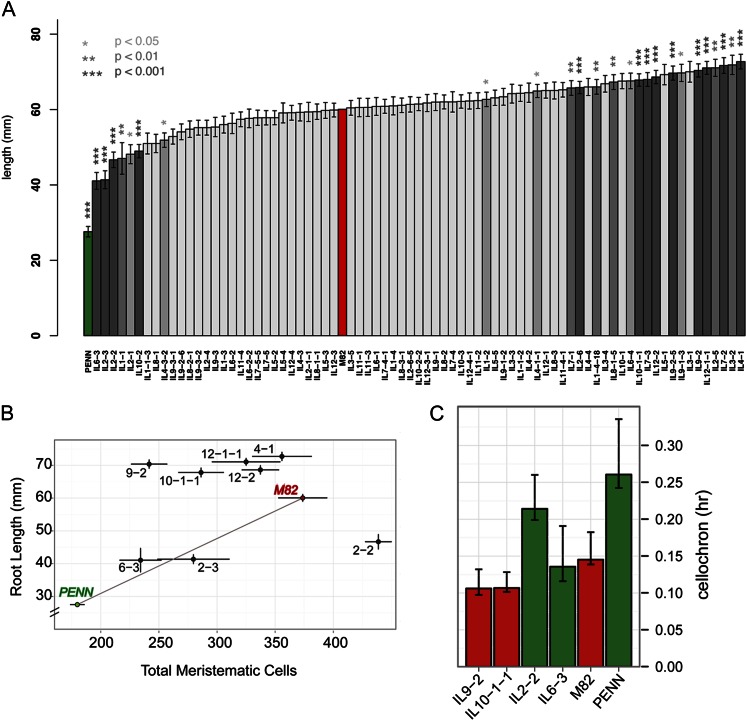
Figure 4.
Identification of QTLs regulating root length. A, Mean root length values across ILs. Asterisks and bar shading indicate corrected significance as determined using the Dunnett multiple hypothesis testing correction method. Error bars represent se. Parent’s values are shown in red (cv M82) and green (S. pennellii). B, Correlation of root length and meristematic zone cell number in parents and a subset of ILs. Parents are colored red (cv M82) and green (S. pennellii). Error bars represent se. Total meristematic zone cell number is calculated as the number of cells in the outer and inner cortex layer and in the endodermis. C, Cellochron analysis to determine the dynamic rate of addition of a cell to the root’s elongation zone. PENN, S. pennellii.

