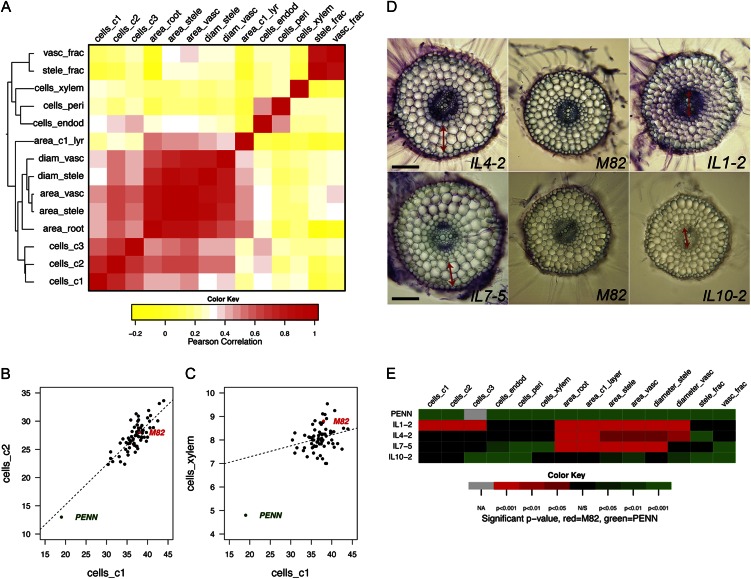
Figure 7.
The correlation of cellular traits. A, Correlation plot showing overall similarity in cell number and other traits. B–C, Plots showing partial correlation between cell number in cells_c1 and cells_c2 and in cells_c1 and cells_xylem. D, Cross sections illustrating growth constraints. The double-headed arrow indicates the tissue layer, which has expanded presumably to compensate for a change in division in another cell layer. Bar = 100 µm. E, A subset of the heat map in Figure 6 corresponding to the ILs shown in D. Abbreviations are as for Figure 2.

