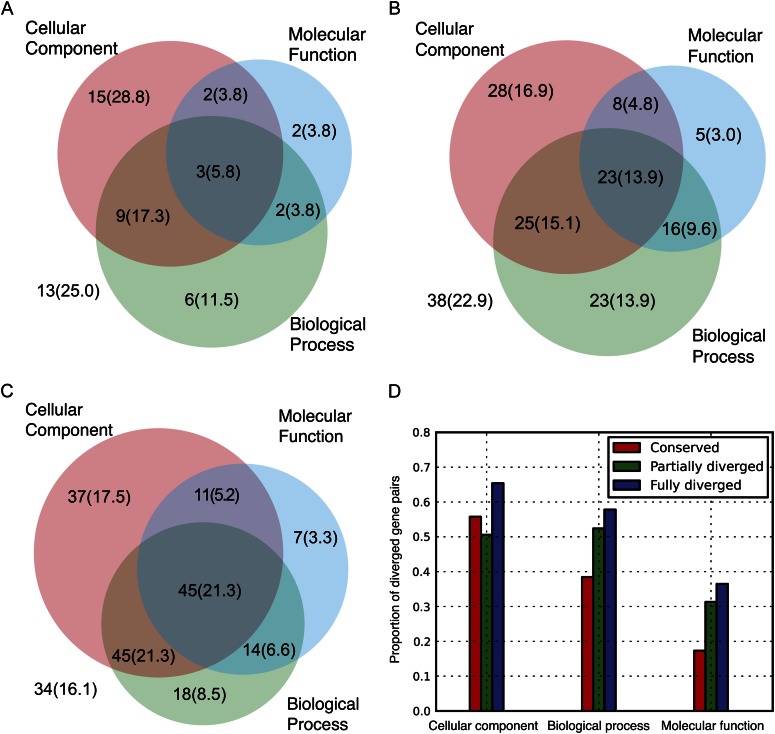
Figure 3.
Function divergence indicated by GO-slim terms. Venn diagrams show the numbers of diverged gene pairs in three Gene Ontology (GO) function categories. The integer indicates the number of gene pairs that shows diverged GO annotations in the function category. The number in parentheses shows the percentage. The numbers outside all three circles represents the number (percentage) of nondiverged gene pairs in all three GO function categories. A, Conserved. B, Partially diverged. C, Fully diverged. D, Proportion of diverged gene pairs in each GO category.

