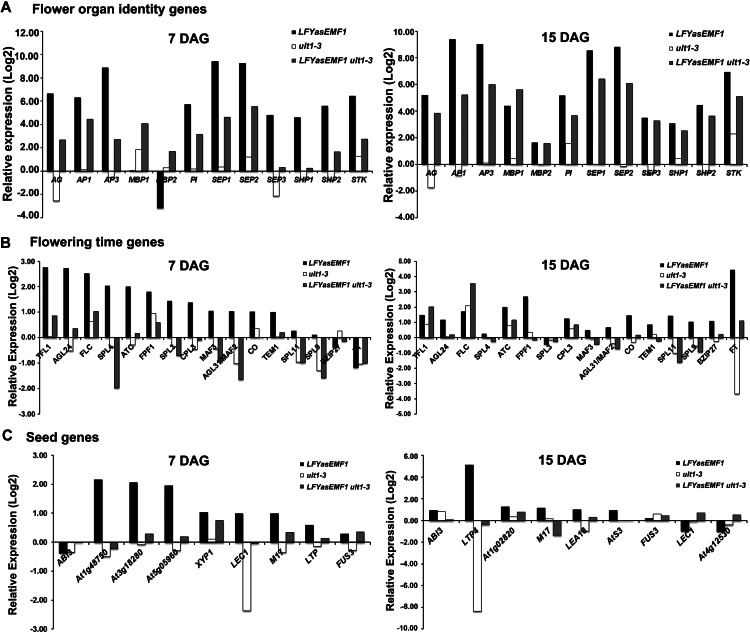
Figure 4.
Opposite regulation of gene expression by EMF1 and ULT1. A, Relative expression levels of flower MADS box genes in plants at 7 DAG (left panel) and 15 DAG (right panel) using data based on GeneChip analysis. The log2 values of the fold change were calculated for comparison of the changes in gene expression levels in LFYasEMF1, ult1-3, and LFYasEMF1 ult1-3 plants relative to wild-type plants. A log2 ratio of 1 is the same as a 2-fold change in gene expression. B, Relative expression changes of flowering-time genes. C, Relative expression changes of seed genes.

