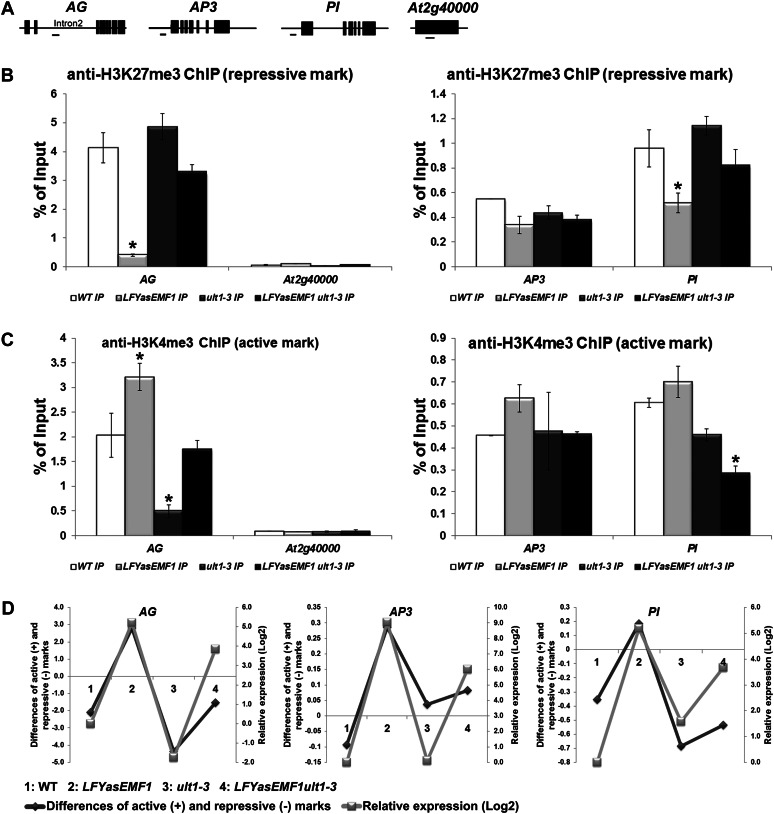
Figure 7.
Influence of EMF1 and ULT1 on AG, AP3, and PI histone methylation patterns and transcriptional activities. A, Schematic representation of AG, AP3, PI, and AT2G40000 gene structures. The exon/intron structures are depicted as black boxes/black lines. The regions amplified by qPCR are depicted as horizontal lines below the schemes. B, ChIP analysis of H3K27me3 levels at the AG, AP3, and PI loci in wild-type (WT), LFYasEMF1, ult1-3, and LFYasEMF1 ult1-3 seedlings at 15 DAG. Anti-H3K27me3 antibody was used to immunoprecipitate (IP) nuclear proteins from plants. Input is preimmunoprecipitated DNA after sonication. ChIP products were analyzed by qPCR using the primers corresponding to the gene region shown in A. ChIP results are expressed as a percentage of input DNA, with error bars representing sd of three replicates. C, ChIP analysis of H3K4me3 levels at the AG, AP3, and PI loci in wild-type, LFYasEMF1, ult1-3, and LFYasEMF1 ult1-3 seedlings at 15 DAG. ChIP and qPCR were carried out as described in B. Asterisks in B and C indicate values that are significantly different from the wild type (P < 0.05 using Student’s t test). D, Correlation between the relative mRNA expression levels (log2) and the difference between the active H3K4me3 (+) and repressive H3K27me3 (−) marks on the AG, AP3, and PI genes calculated by subtracting the enrichment level of the repressive H3K27me3 signal from that of the active H3K4me3 signal based on qPCR results in B and C. The relative expression levels of AG, AP3, and PI in plants at 15 DAG were based on GeneChip data (Supplemental Table S1). The log2 values of the fold changes were calculated for comparisons of the changes in expression level for each gene in the four plant samples. A log2 ratio of 1 is the same as a fold change of 2.

