Figure 3.
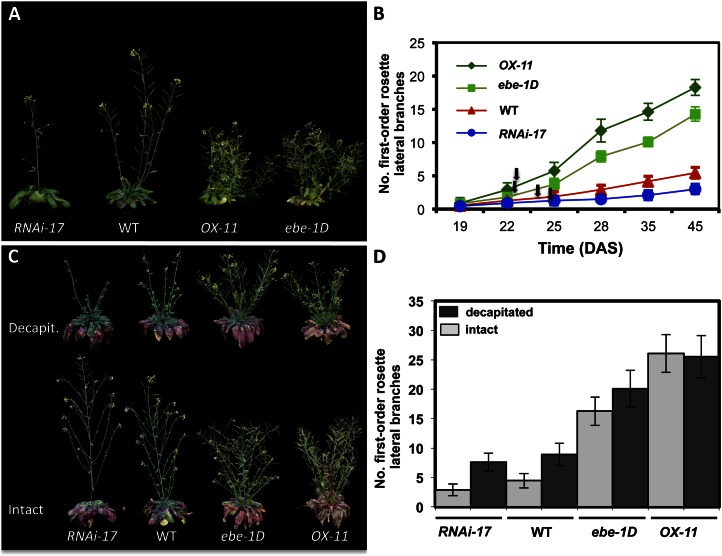
Phenotypic effects of altered EBE transcript level. A, Phenotypes of 33-d-old transgenic EBE lines compared with wild-type (WT) plants, grown in long-day conditions. B, Number of first-order rosette lateral branches in 35S:EBE (OX-11), ebe-1D, wild-type, and EBE-RNAi-17 plants. Given are means ± sd of 11 different plants of each line at each stage. At time points 28, 35, and 45 d after sowing (DAS), the differences between wild-type and all transgenic plants are statistically significant (Student’s t test after false discovery rate correction, P < 0.01). Arrows indicate flowering time for each line. Flowering time of the transgenic plants did not significantly differ from that of the wild type under our experimental conditions (Student’s t test after false discovery rate correction, P > 0.05; Supplemental Table S5). C, Phenotype of transgenic plants 12 d after decapitation (top) compared with intact plants that were not decapitated (bottom). Plants were 3 months old. D, Number of first-order rosette lateral branches of wild-type and transgenic plants at 12 d after removal of the main shoot, compared with intact plants. In wild-type plants, approximately 50% of the buds in primary rosette branches grew out, whereas in RNAi, ebe-1D, and OX-11 lines, approximately 38%, 80%, and 100%, respectively, of the buds did. Data represent means ± sd (n = 11). Data for intact versus decapitated plants were significantly different for all lines except the strong EBE overexpressor line OX-11 (Student’s t test, P < 0.01).

