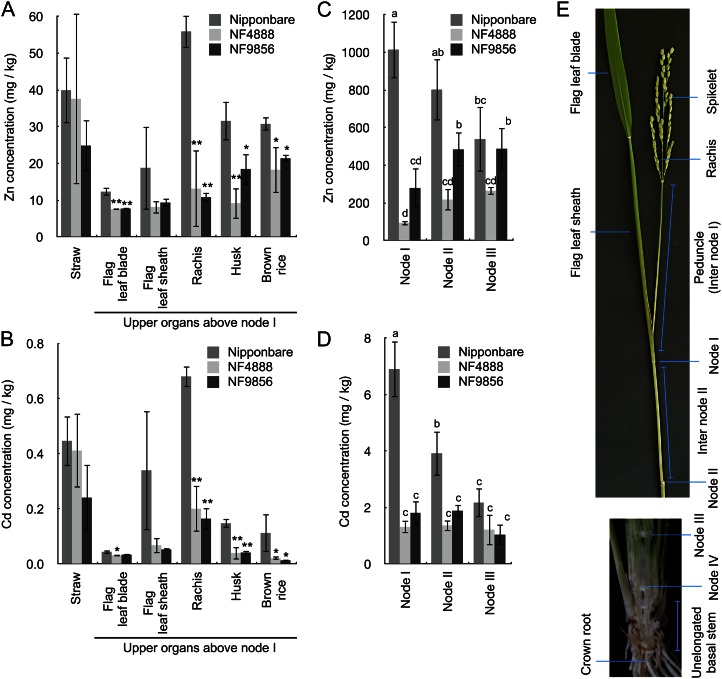
Figure 5.
Metal concentration of wild-type rice and oshma2 mutants at harvest. A and B, Concentration of zinc (A) and cadmium (B) in different tissues. C and D, Concentration of zinc (C) and cadmium (D) in different nodes. The wild-type rice ‘Nipponbare’ and two oshma2 mutants (NF4888 and NF9856) were grown in a paddy field till ripening. Error bars represent ± sd of three independent biological replicates. Statistical comparison was performed by one-way ANOVA followed by the Tukey’s multiple comparison test. Data were compared with cv Nipponbare (*P < 0.05, **P < 0.01 [A and B]). Different letters indicate significance (P < 0.05 [C and D]). E, Different organs sampled used for analysis at the heading stage. Organs above node II (top, leaf attached to node II was removed) and longitudinal section of shoot basal region containing approximately 10 unelongated nodes (bottom) are shown.

