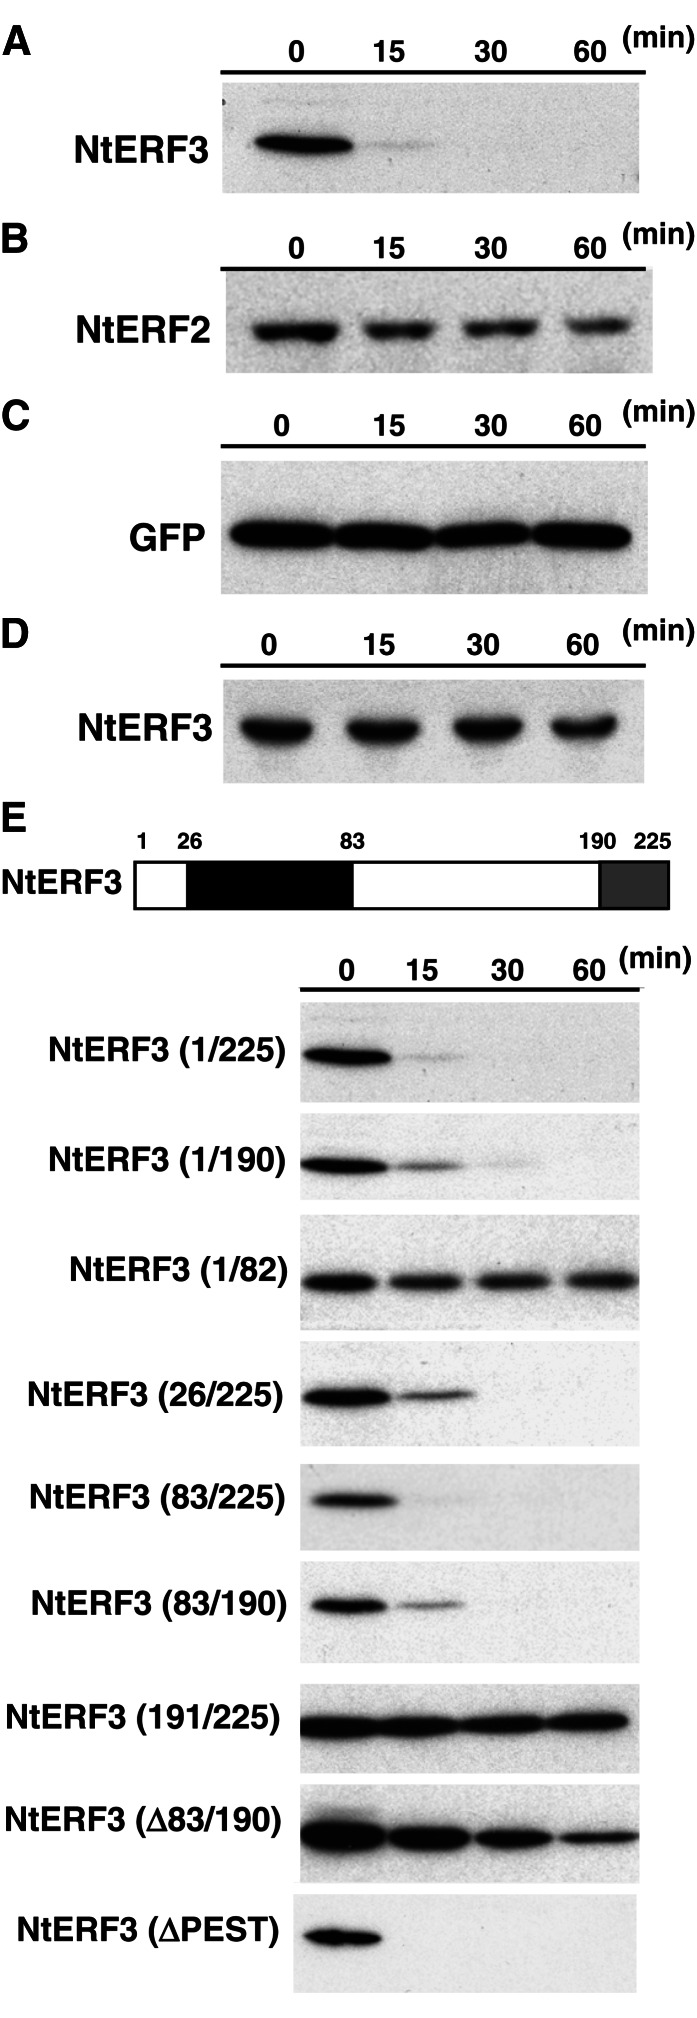
Figure 1.
Rapid degradation of NtERF3 in vitro. A to D, Levels of recombinant NtERF3 (A and D), NtERF2 (B), and GFP (C) incubated in the cell extract (A–C) or bovine serum albumin (D) solutions for the indicated times. Recombinant NtERF3, NtERF2, and GFP were detected via immunoblotting using anti-NtERF3 (A and D), anti-NtERF2 (B), and anti-GFP (C) antibodies, respectively. E, Mapping the domain responsible for NtERF3 instability in vitro. The top section shows a schematic representation of NtERF3. Black and gray boxes indicate the DBD and EAR repression domain, respectively. Numbers show the position of amino acid residues from the first Met. The bottom sections show the levels of the respective regions of NtERF3 at the time points indicated in the cell extract solution. These regions of NtERF3 were detected via immunoblotting using an anti-NtERF3 antibody. The molecular size of each protein is provided in Supplemental Fig. S1.

