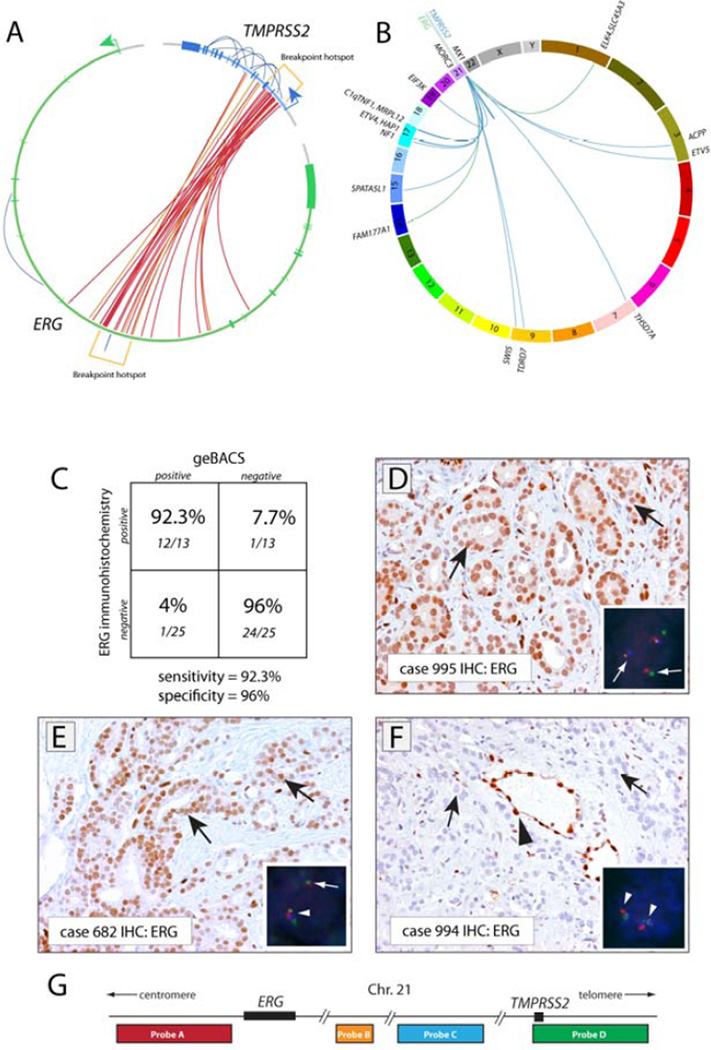
FIGURE 2. Genomic architecture and in situ confirmation of rearrangements involving TMPRSS2 and/or ERG.
(A) Circos plot depicting 26 rearrangements between TMPRSS2 and ERG identified in 25 out of 83 prostate cancer tissues analyzed. Each inner line represents a TMPRSS2-ERG rearrangement. Outer lines represent intragenic rearrangements within the TMPRSS2 or ERG loci. Red links represent rearrangements identified with standard orientation (5’ sense fragment of TMPRSS2 fused to a 3’ sense fragment of ERG). Orange links represent nonstandard rearrangements as noted in the text. Rearrangement hotspots are noted in brackets. (B) Circos plot showing inter-chromosomal rearrangements involving TMPRSS2 or ERG with other genes. The gene name of the overlapping or closest fusion partner gene is indicated. Blue and green lines indicate rearrangements involving TMPRSS2 or ERG, respectively. (C) Specificity and sensitivity of the geBACS pipeline in identifying TMPRSS2-ERG rearrangements, determined by using ERG IHC. (D) Strong nuclear staining for ERG in tumor cells in a representative prostate cancer case with FISH-confirmed TMPRSS2-ERG rearrangement by translocation, for which the TMPRSS2-ERG rearrangement junction was identified by geBACS. Insert shows four-color FISH for TMPRSS2 and ERG. In inserts, white arrows indicate rearranged alleles, arrowheads normal alleles. (E) Positive ERG staining in a case with FISH-confirmed TMPRSS2-ERG rearrangement associated with deletion (see insert) for which the TMPRSS2-ERG rearrangement junction was identified by geBACS. (F) Absence of ERG staining in a case that did not show TMPRSS2-ERG rearrangement by FISH or geBACS. (G) Scheme of FISH probe localization on chromosome 21. (D–F) Black arrows indicate representative cancer cells; Black arrowhead indicates positive ERG staining in normal endothelial cells.

