
Figure 4. Igf2 Accounts for Most of the Paternal Dominance in Chr. 7 UPD.
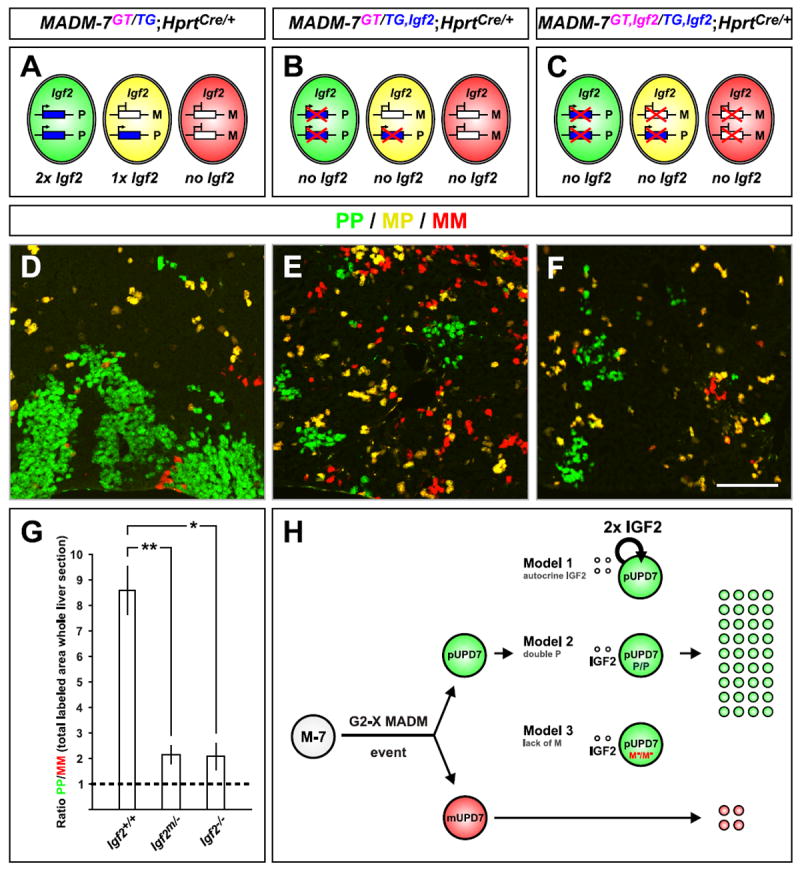
(A-C) Schematic of Igf2 expression in MADM-7GT/TG;Hprt-Cre+/-. (A) Control-MADM-7. (B) Igf2 mutation on paternal chromosome. (C) Igf2 mutation on both, paternal and maternal, chromosomes. Note that due to Igf2 imprinting, most cells in (B) do not express Igf2.
(D-F) Labeling of uniparental Chr.7 disomy (PP cells are green and MM cells are red) in P21 control, paternal Igf2 mutant, or homozygous Igf2-/- mutant MADM animals corresponding to the schemes in (A-C). Scale bar: 110μm.
(G) Quantification of PP/MM ratio in whole liver sections from P21 MADM animals with genotypes indicated. Values represent mean ±SEM, *p<0.05 and **p<0.01.
(H) Three possible models to account for expansion of cells with unipaternal disomy in sparsely generated MADM-7 clones in wild-type animal. Assuming the crossing scheme in Figure 1A, cells with unipaternal Chr.7 disomy (pUPD7) are labeled in green and cells with unimaternal Chr.7 disomy (mUPD7) in red upon a G2-X MADM event. Green pUPD7 cells express a double dose of Igf2 and P factor(s) but lack M factor(s), where P or M factors represent additional imprinted genes on Chr. 7 that could act cell-autonomously to promote or inhibit IGF2 signaling, respectively. In Model 1, IGF2 (double dose) signals strictly autocrine to only pUPD7 but not to mUPD7. In Model 2, the double dose of additional imprinted P factor(s) act in concert with secreted IGF2 to convey the growth advantage in pUPD7. In Model 3, the lack of M factor(s), which normally would tune down the IGF2 signal to a certain extent, promotes increased IGF2 growth signaling in pUPD7 cells. The cell-type specificity of UPD7 effects we observed may be a consequence of cell-type specific expression of the M or P factors, or cell type-specific interactions of these factors with IGF2.
See also Figures S3 and S4.