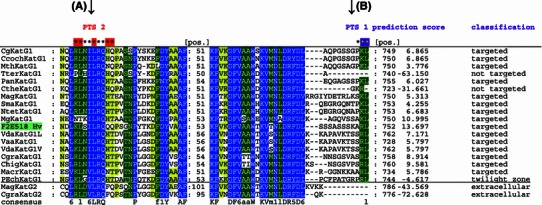
Fig. 6.

Protein multiple sequence alignment showing the presence (or absence) of PTS1 and PTS2 signals in 20 selected KatG sequences. Color scheme in columns: blue, highest level of conservation; green, intermediate level of conservation; yellow, low level of conservation. Left side region around PTS2 near the N-terminus of KatG proteins. Right side region on the C-terminus with PTS1 comprising last 12 amino acids. For complete alignment see Supplemental Figure 2
