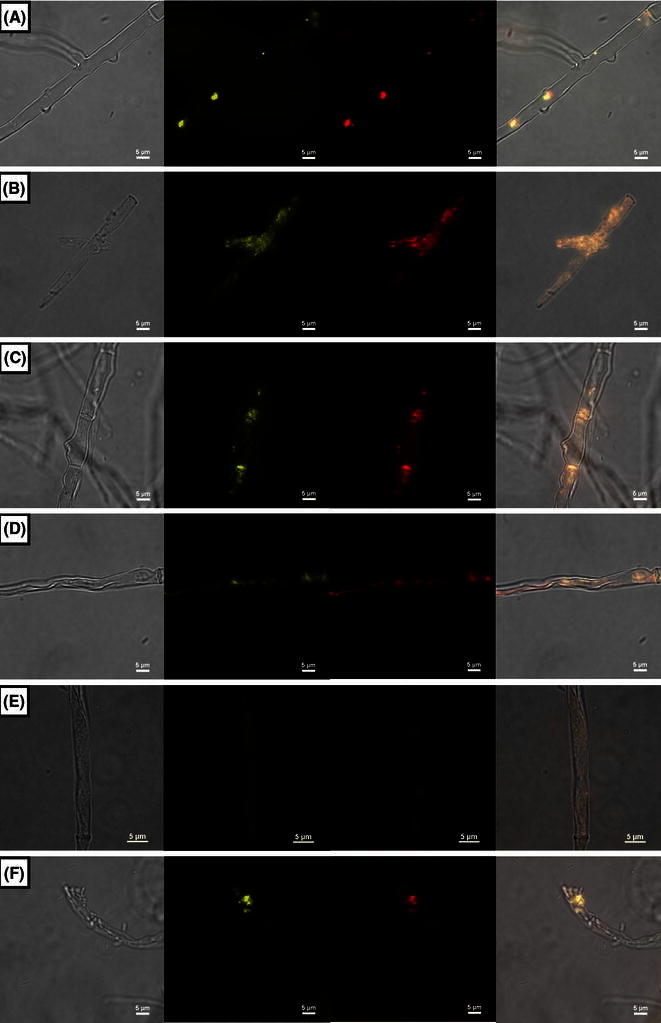
Fig. 8.

Co-localization of KatG and 3-ketoacyl-CoA thiolase detected with immunofluorescence microscopy. A, B – Magnaporthe grisea; C,D – Chaetomium cochliodes; E,F- Chaetomium globosum. A,C,E – noninduced samples; B,D,F – samples after induction with oleic acid. Presentation of panels from left to right: bright field (no fluorescence), FITC channel, TRITC channel, merged picture, respectively
