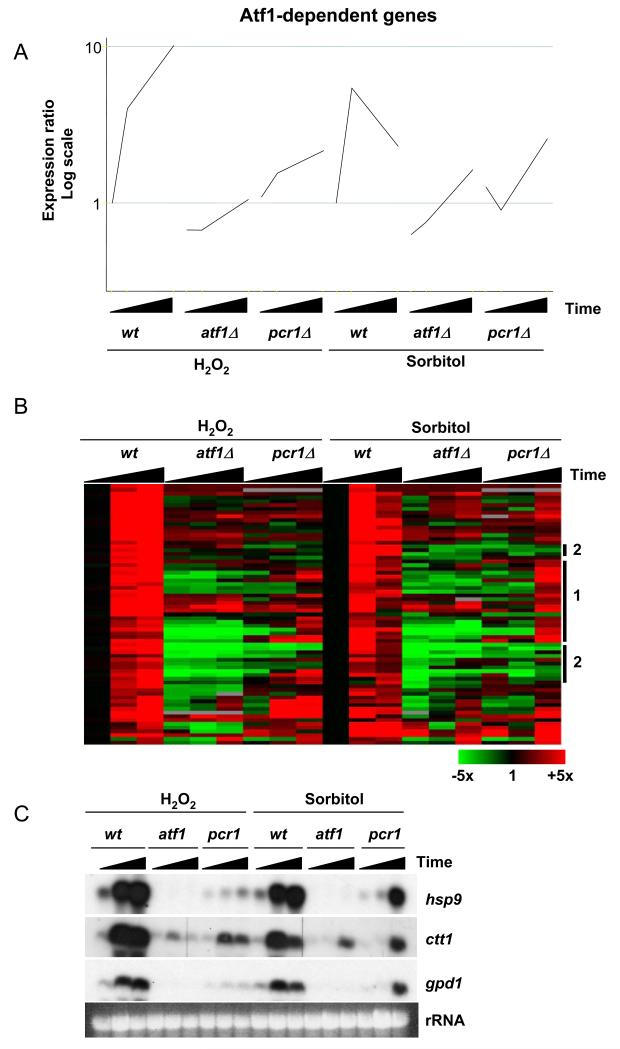
Figure 10.
The expression of Atf1-dependent genes in a pcr1Δ mutant in response to osmotic and oxidative stress.
(A) The pcr1Δ mutant was treated with 1M sorbitol and 0.5mM H2O2 and samples taken before and at 15 and 60 minutes after stress. The data was compared with gene expression changes that occur in wild type (wt) and atf1Δ cells under the same stress conditions (13). Average gene expression profiles of Atf1-dependent genes in wt, atf1Δ and pcr1Δ cells are shown.
(B) A hierarchical cluster analysis of the data described in (A) is shown with rows representing genes and columns representing experimental time points. The mRNA levels at each time point relative to the levels in the same cells before stress treatments are colour-coded as indicated at the bottom with missing data in grey. Specific gene groups are highlighted at the right as discussed in the main text.
(C) Northern blot to show the expression of the CESR genes analyzed by the ChIP assays. Total RNA was isolated from the strains in the absence of stress and upon 15 or 60 minutes after the application of either osmotic or oxidative stress as described in (A) and is indicated by black wedges. The expression of hsp9, ctt1 and gpd1 was assessed by northern blot using probes corresponding to these genes. Equal loading was assessed by total rRNA.

