Figure 3.

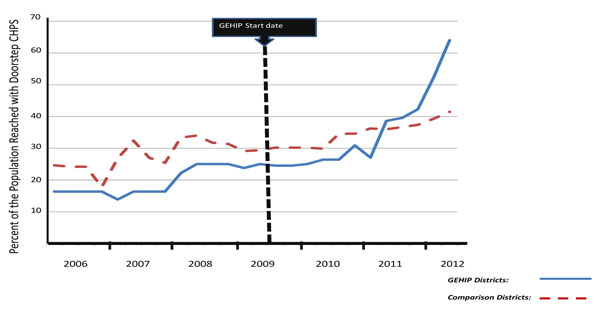
Time trend in the percent of the population reached by CHPS services in GEHIP treatment and comparison districts, January 2006-June 2012.

Time trend in the percent of the population reached by CHPS services in GEHIP treatment and comparison districts, January 2006-June 2012.