
Figure 2.
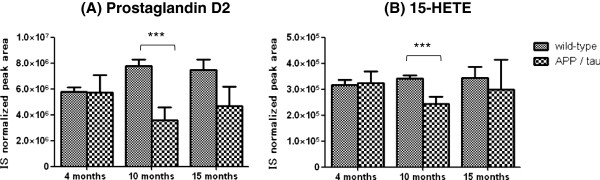
Changes of prostaglandin D2 and 15-HETE levels in brain tissue from APP/tau and wild-type mice. The relative levels of metabolites are represented by the IS normalized peak areas using leukotriene B4-d4 as an IS. ***p< 0.001 by Welch’s t-test. Values are mean ± SD of N = 3–5.