
Figure 3.
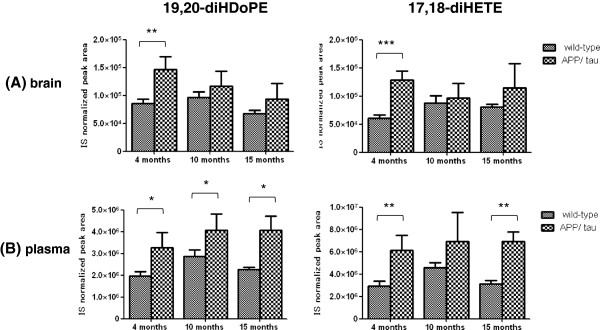
Consistent changes in the levels of two ω-3 fatty acid metabolites in brain tissue and plasma. The relative levels of 19,20-diHDoPE and 17,18-diHETE in brain tissue (A) and plasma (B) are represented by the IS normalized peak areas using leukotriene B4-d4 as an IS. *p < 0.05, **p< 0.01, ***p < 0.001 by Welch’s t-test. Values are mean ± SD of N = 3–5.